01The three second rule
A reader landing on any line must trace it from source to destination in about three seconds. That is the doctrine behind every routing and labelling decision here, and it is not a style guide entry. It is a set of failing gates: no overlaps, no route with more than two bends, no label cut by a foreign line, no two edges sharing a lane, no text below the legibility floor. If a render breaks the rule, the build is red.
02What it draws
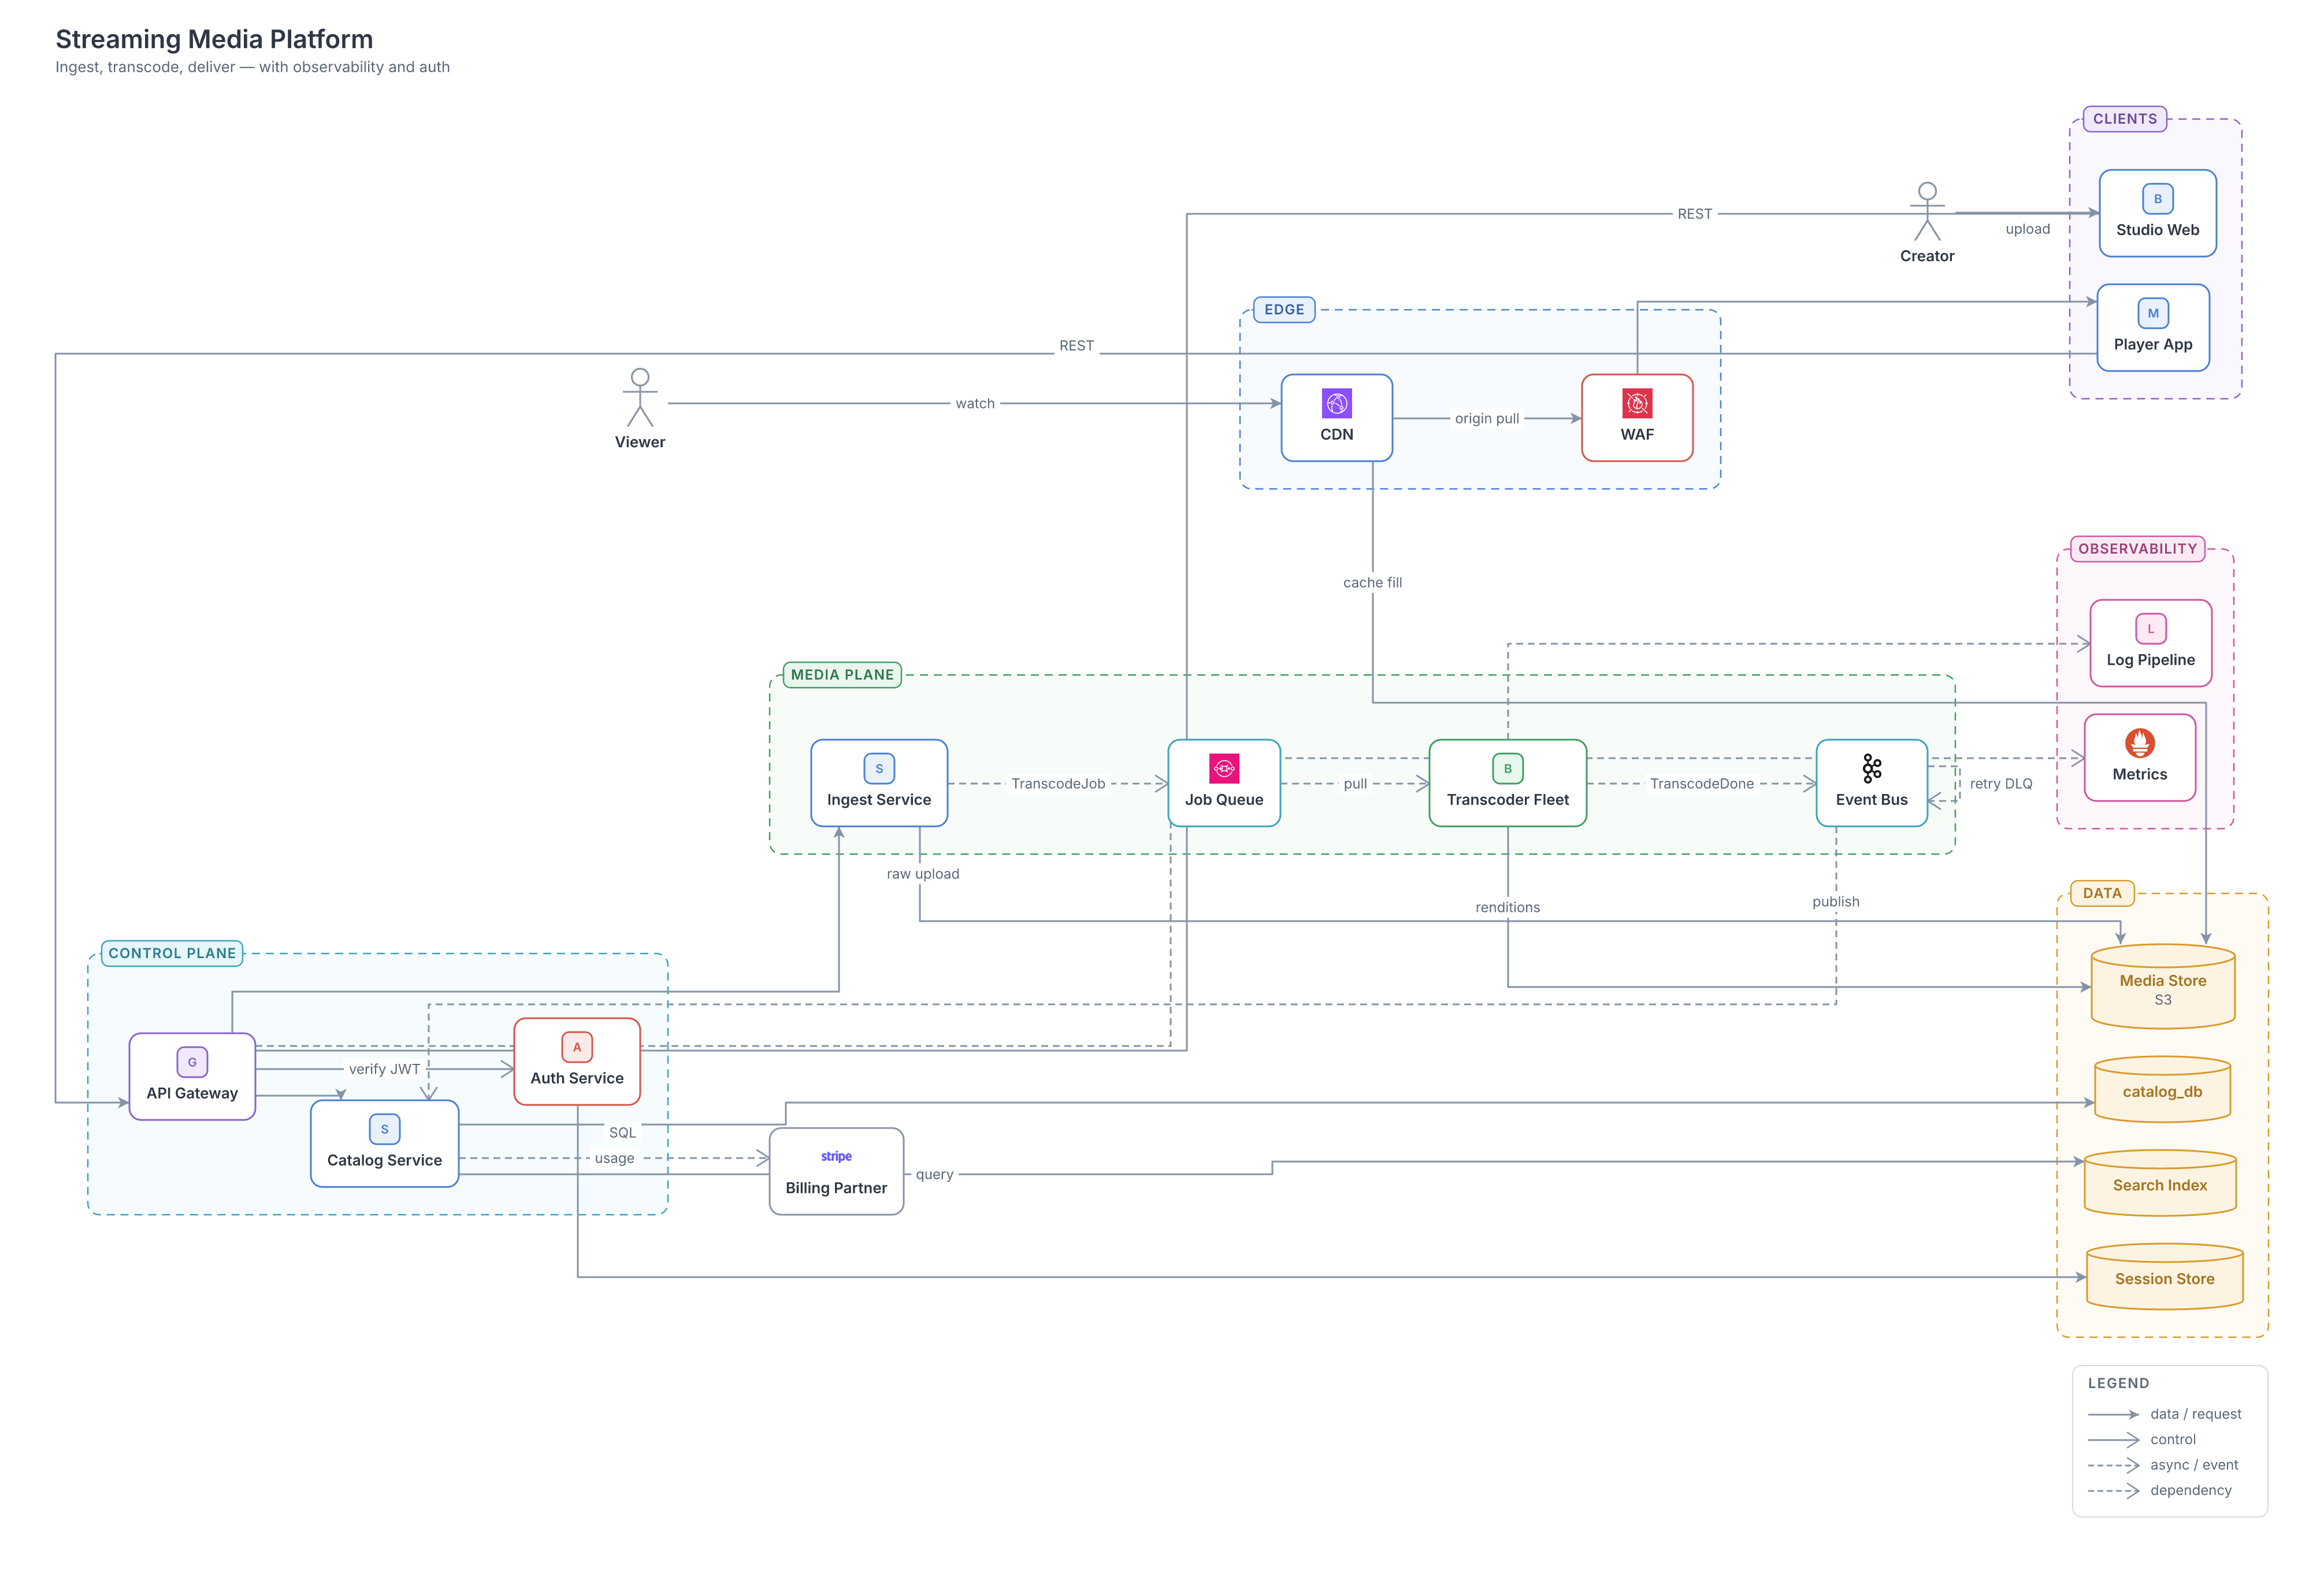
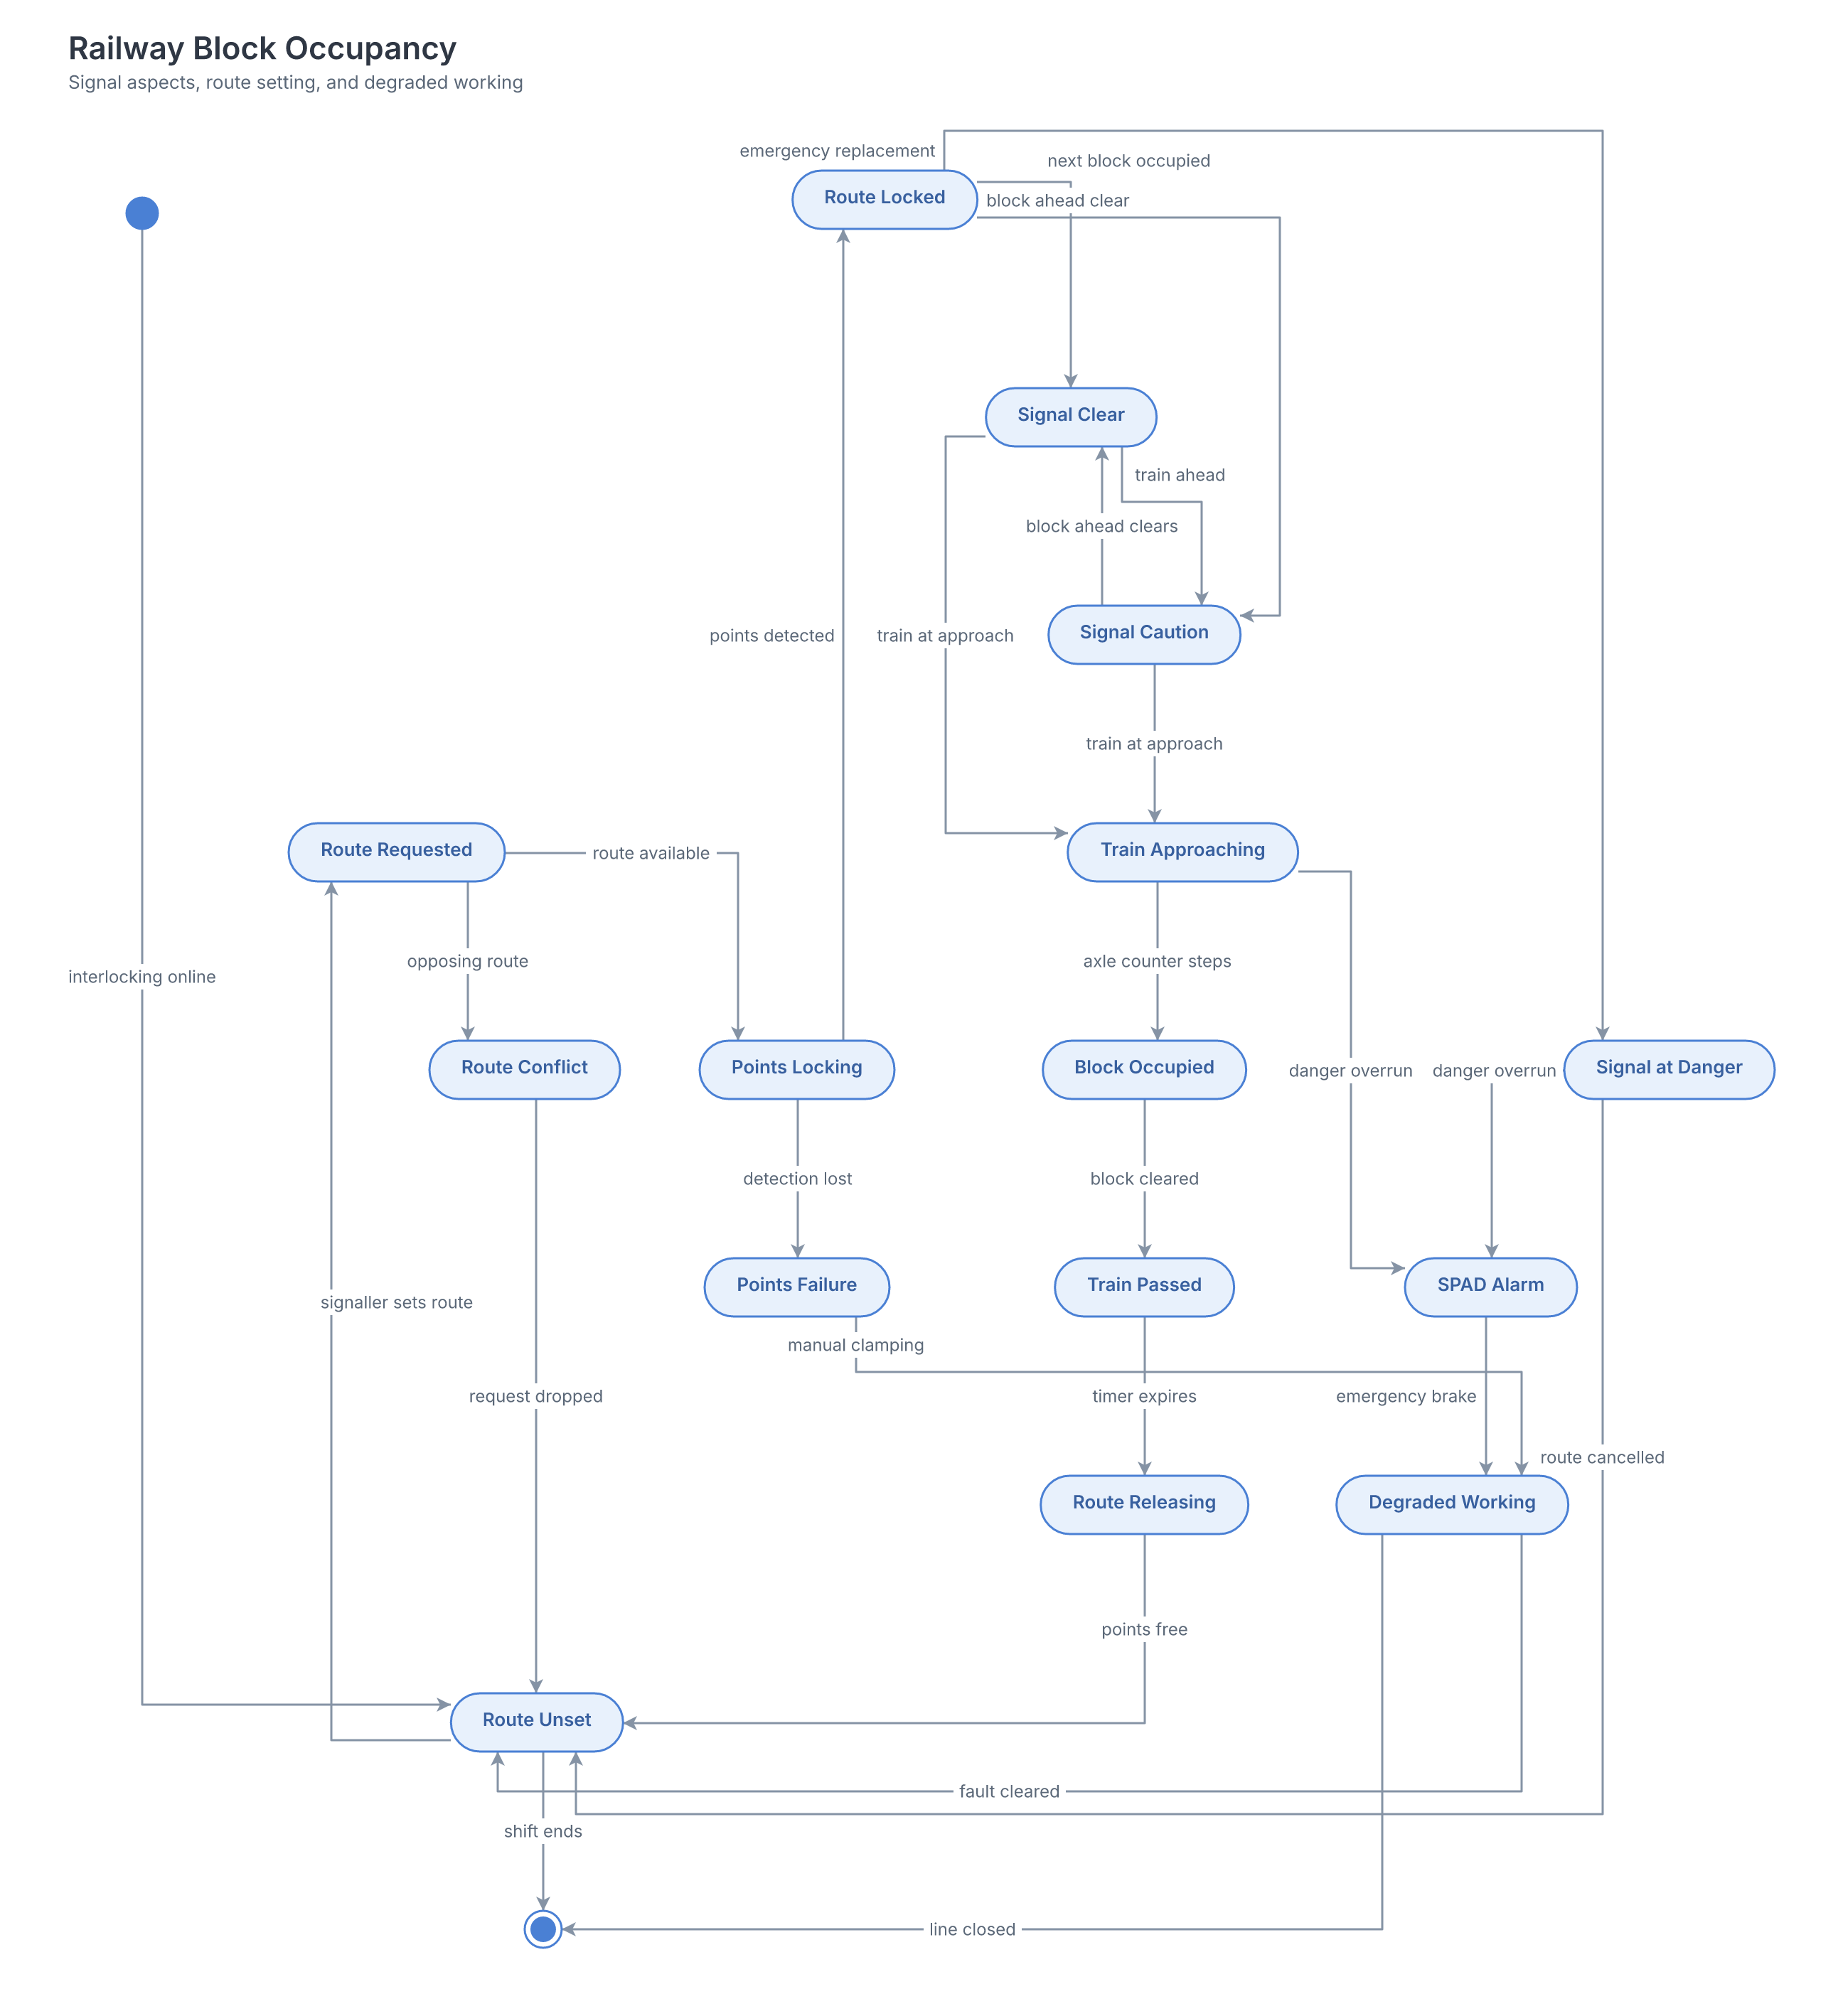
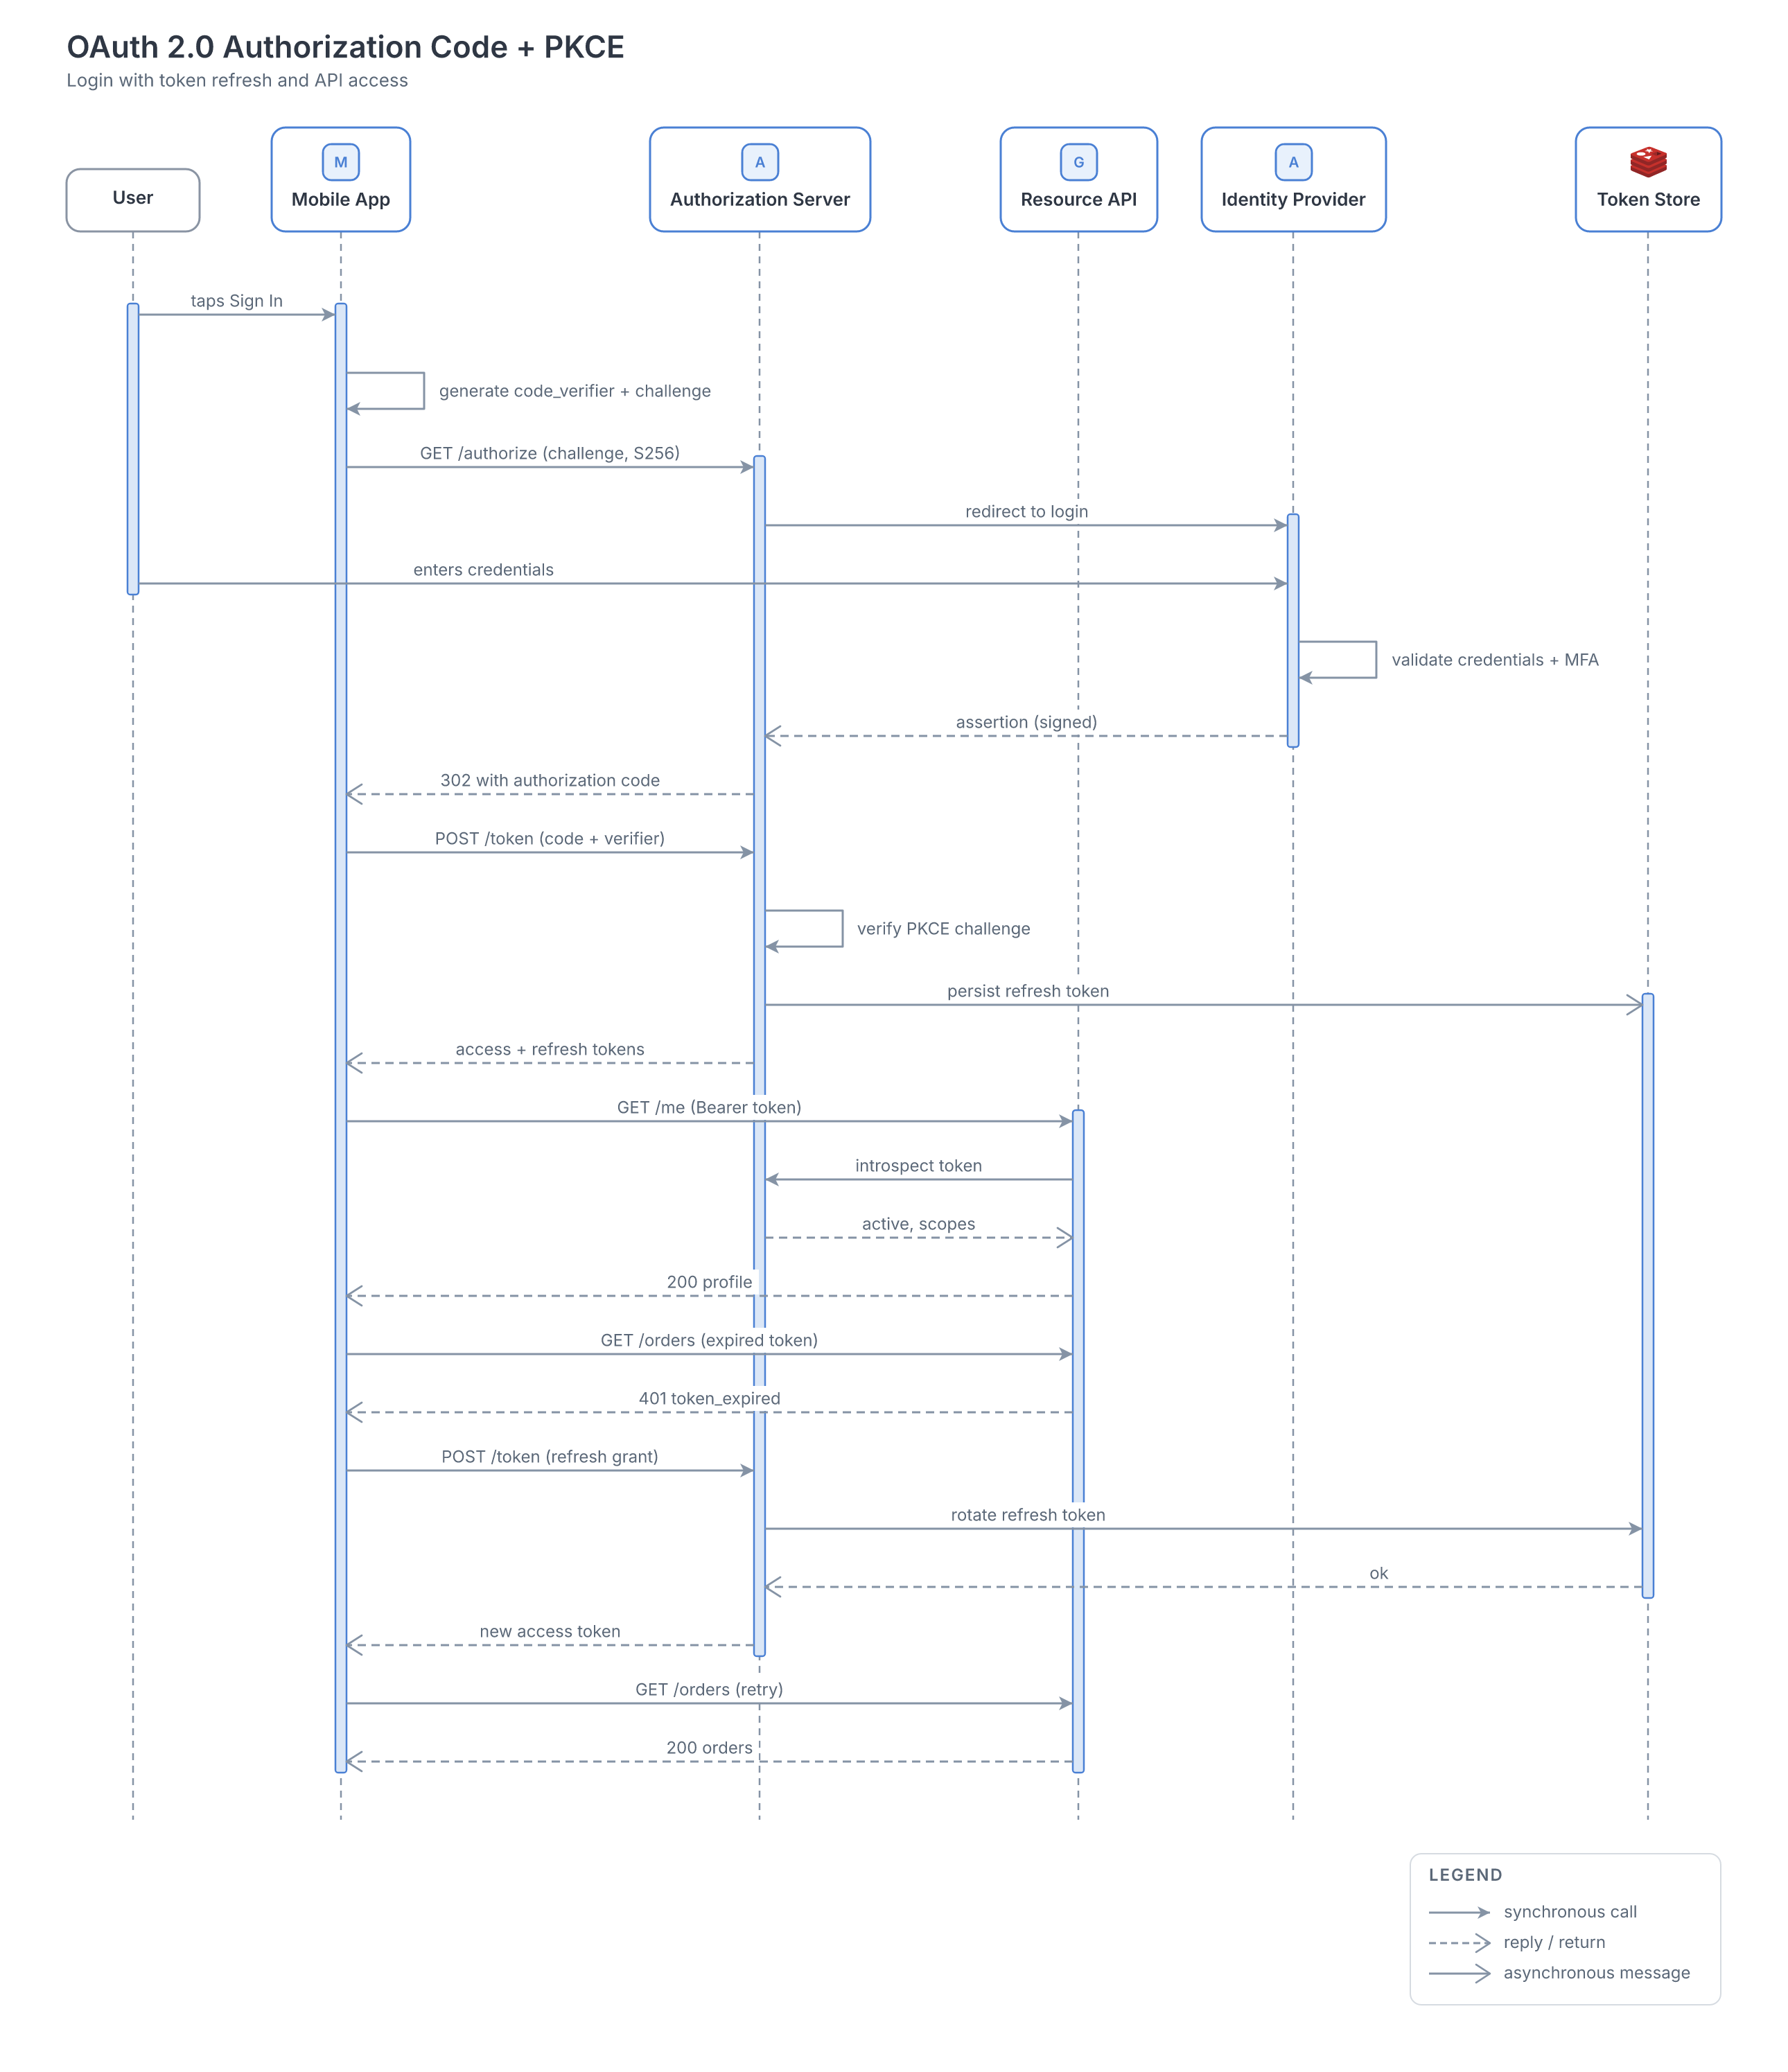
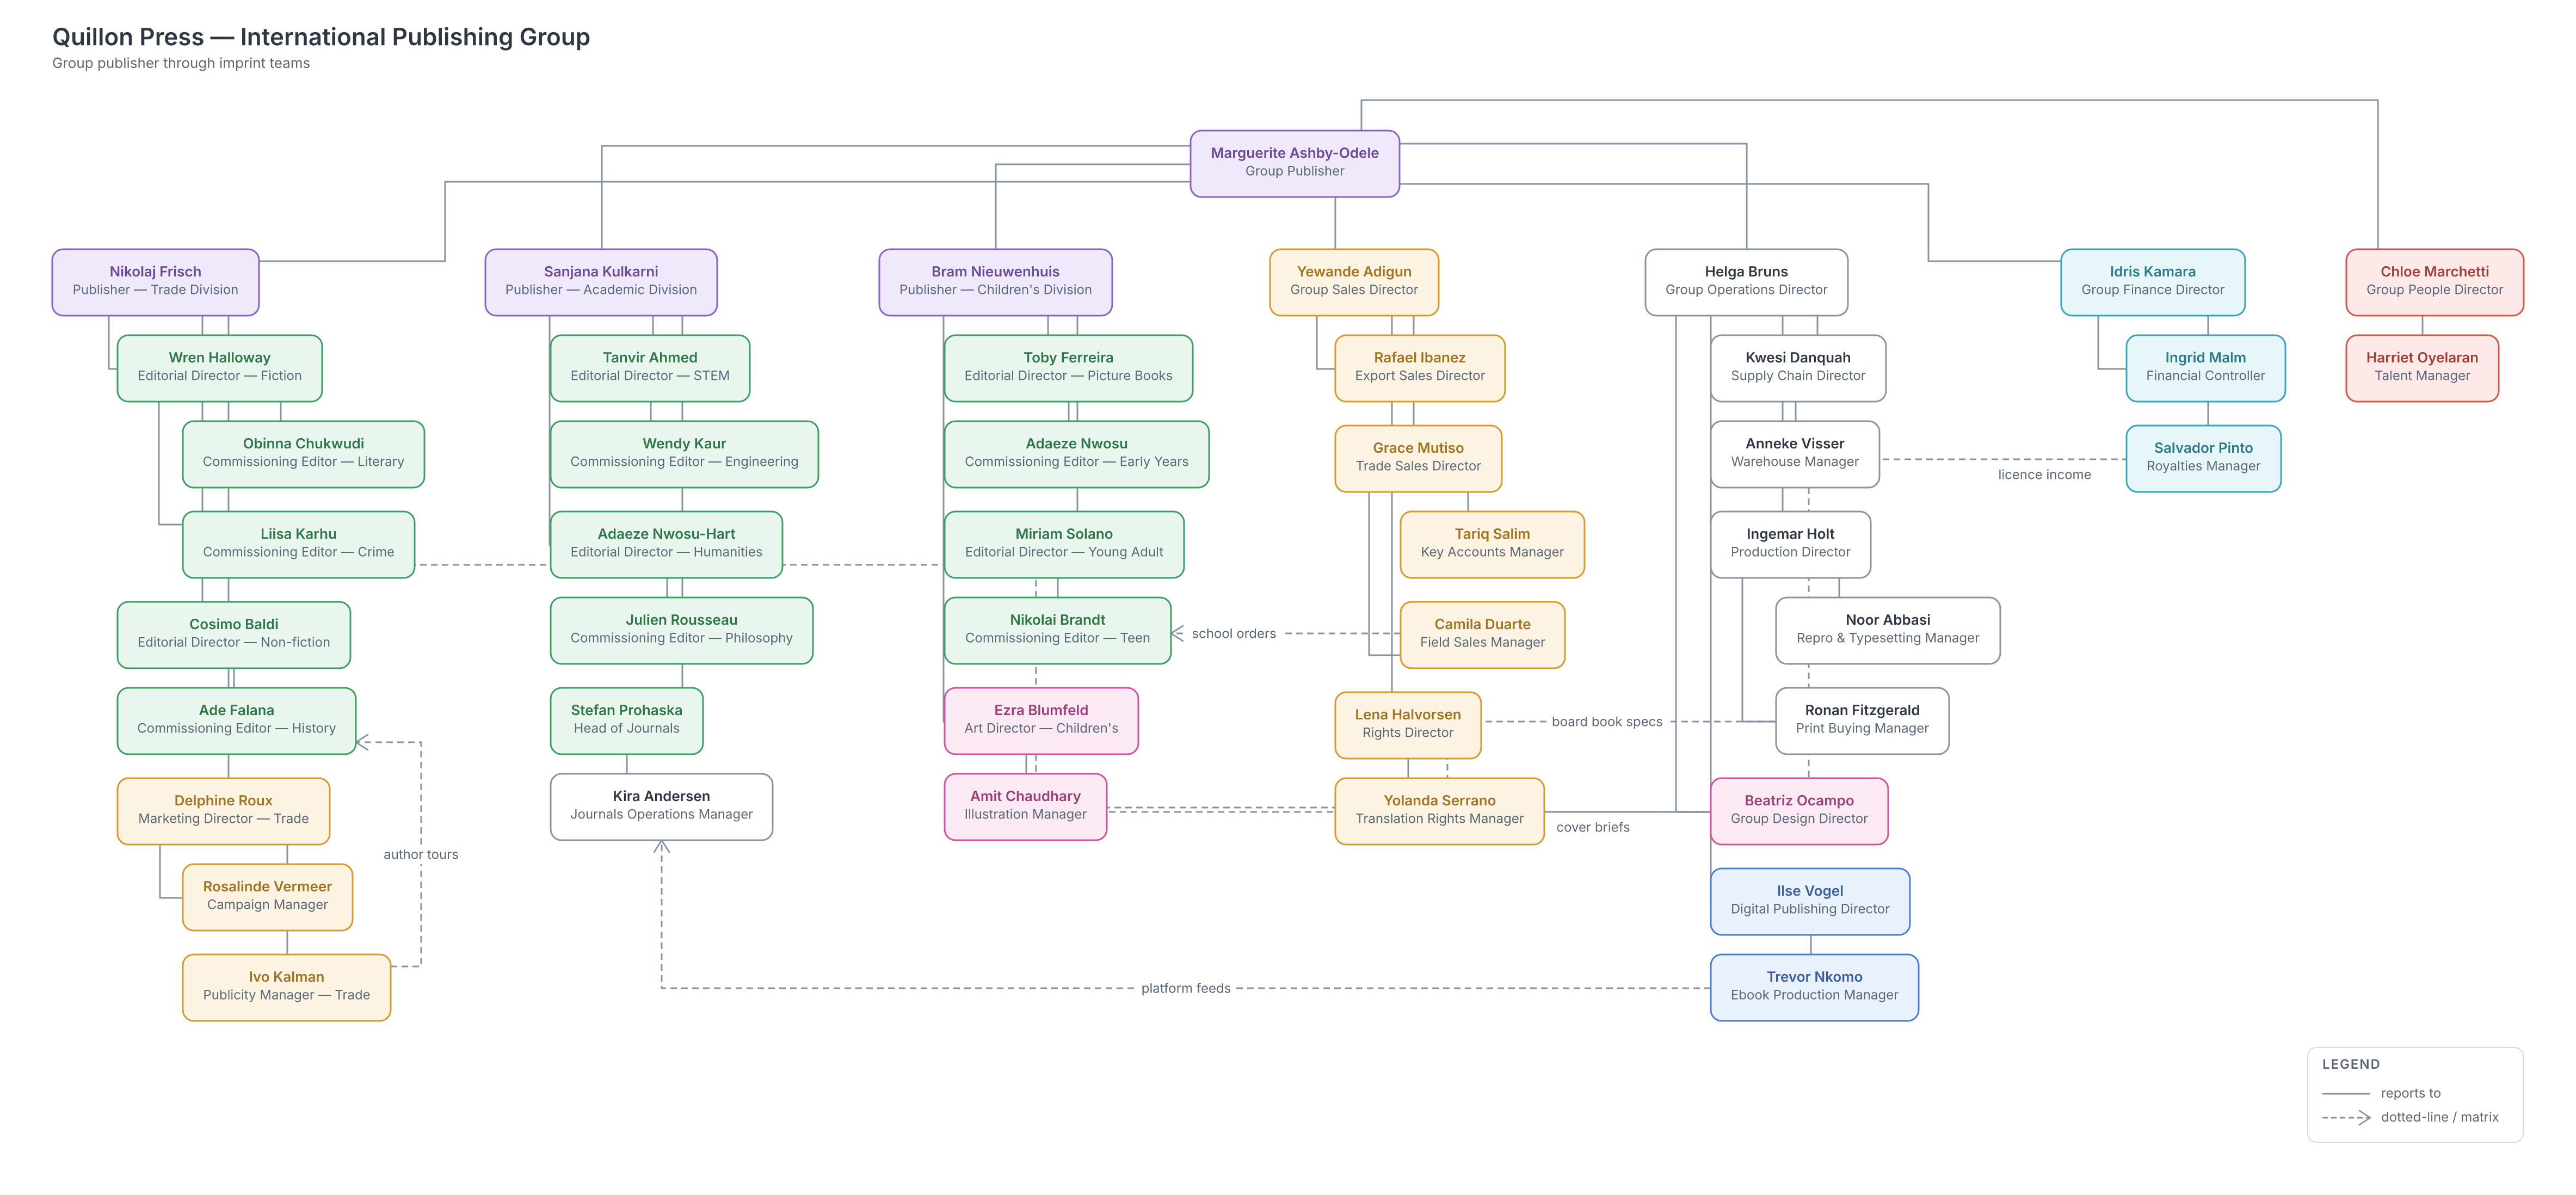
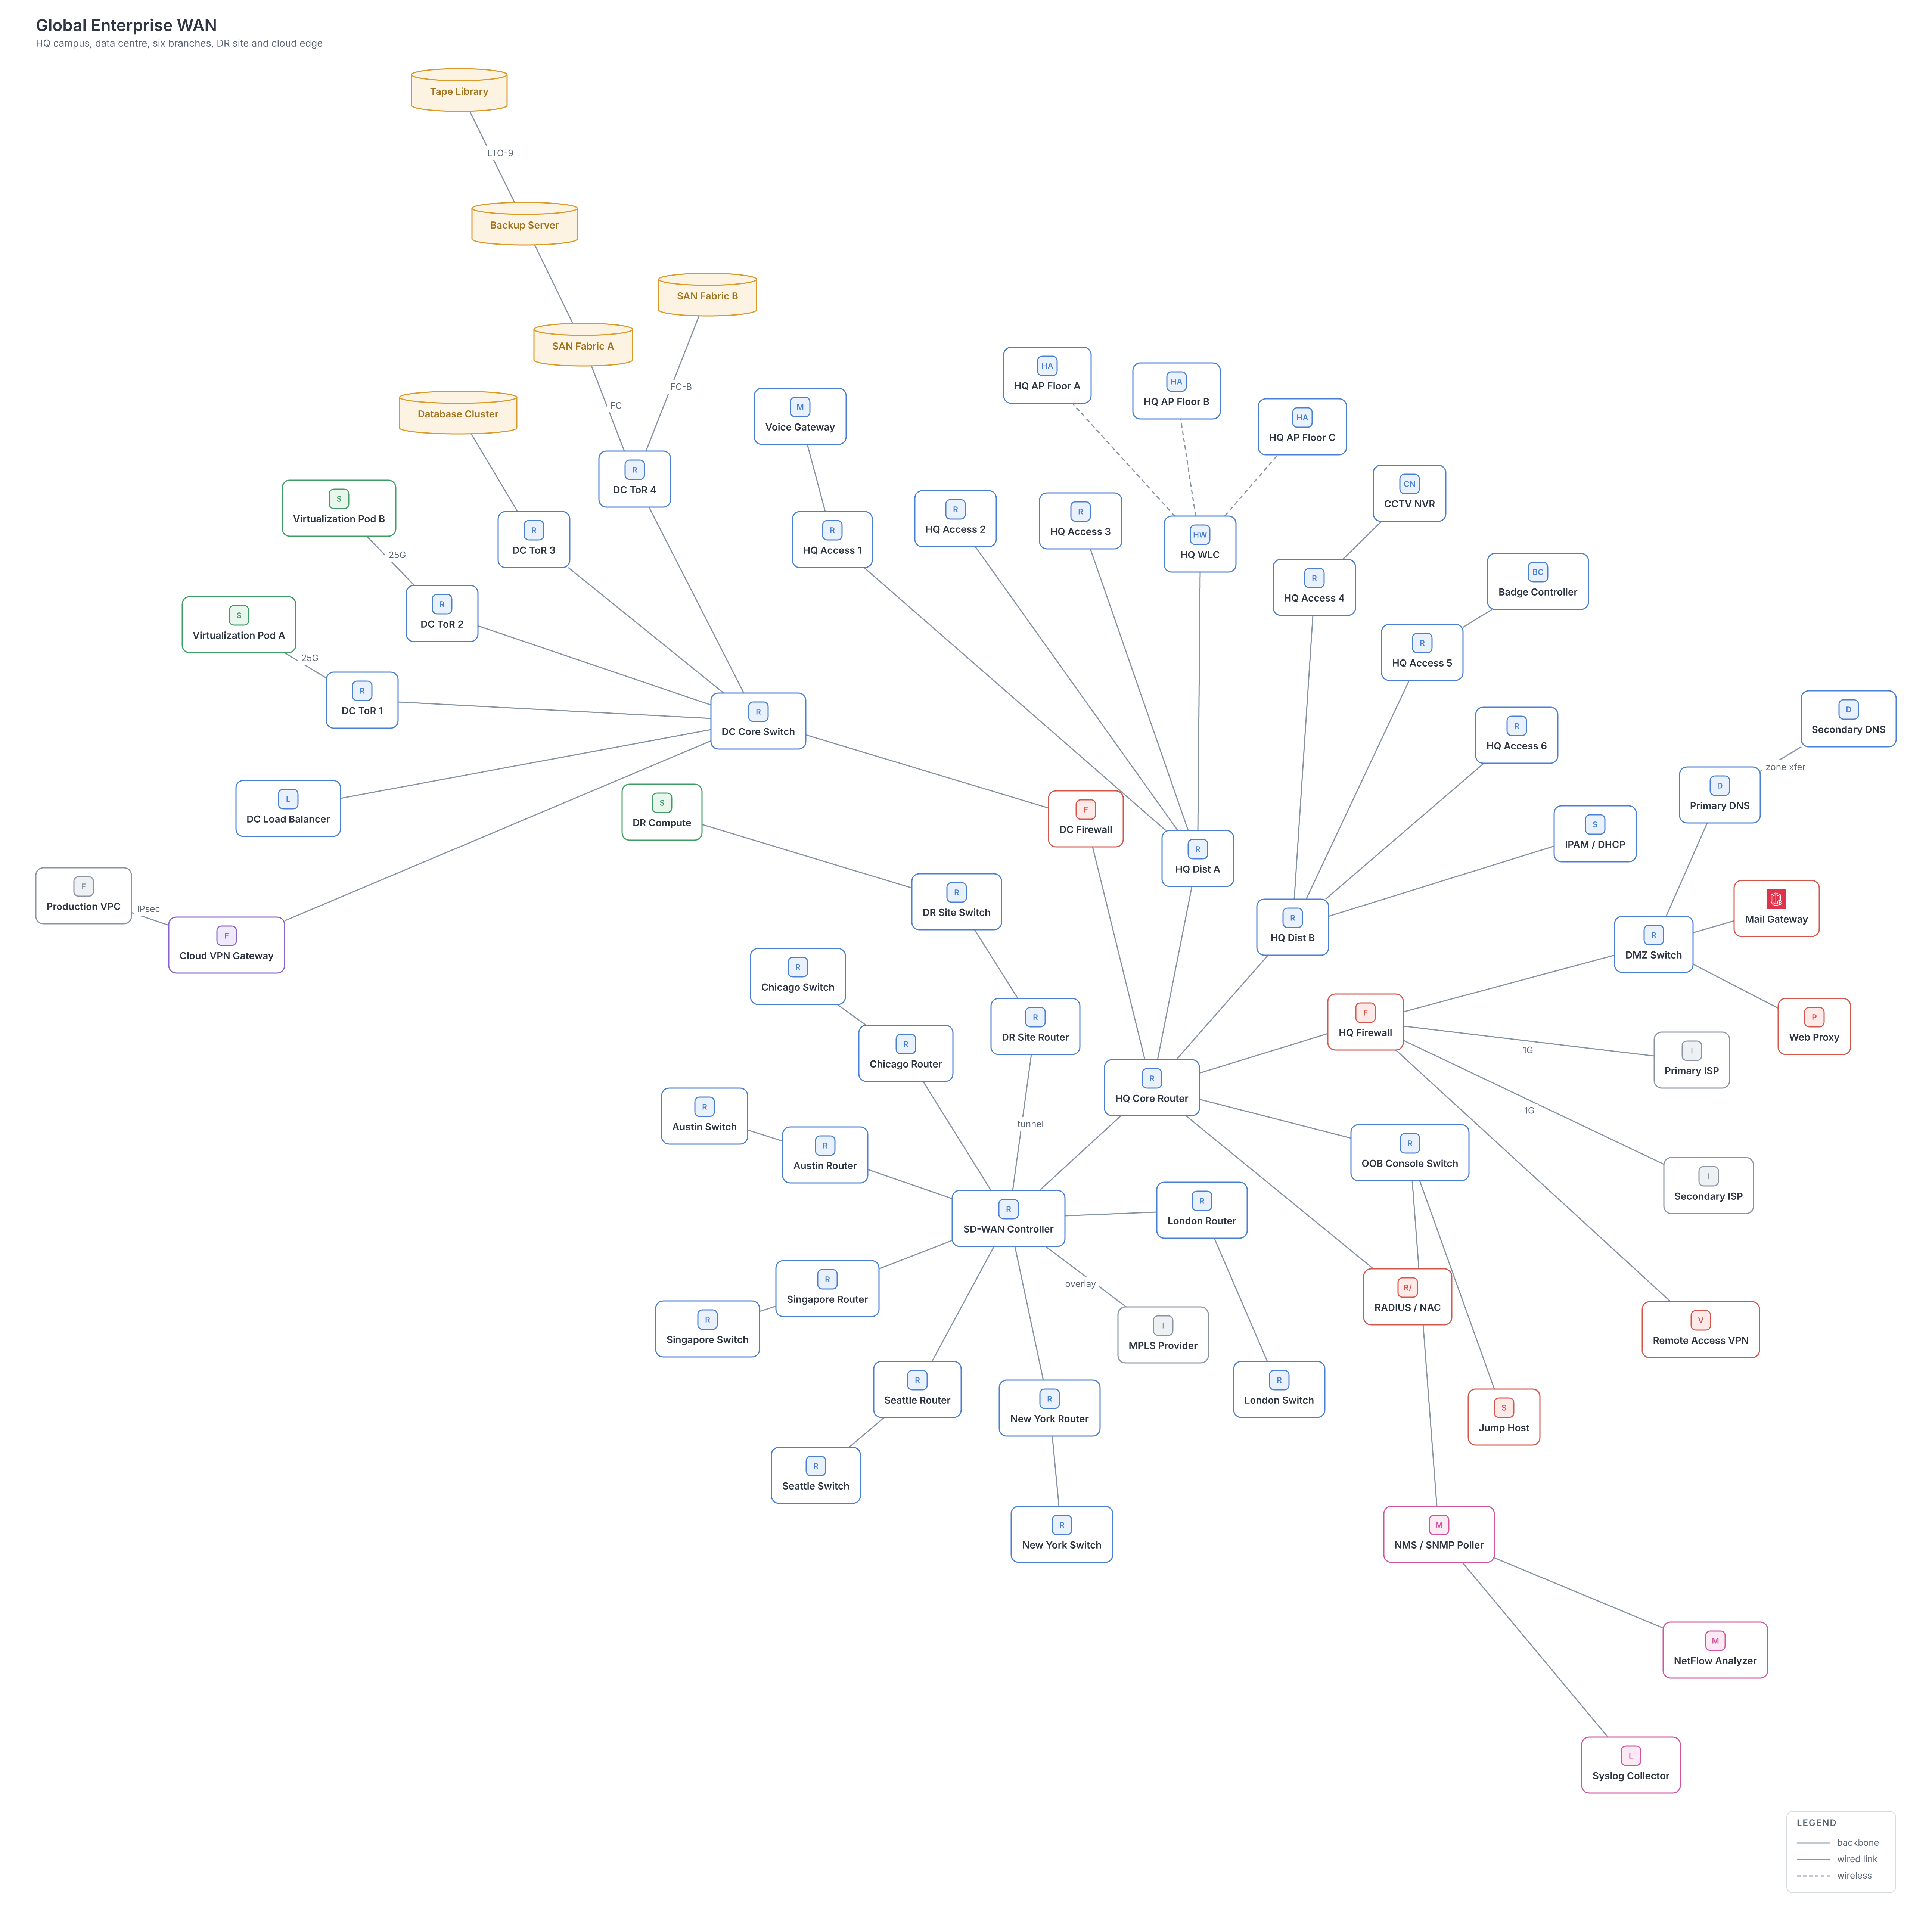
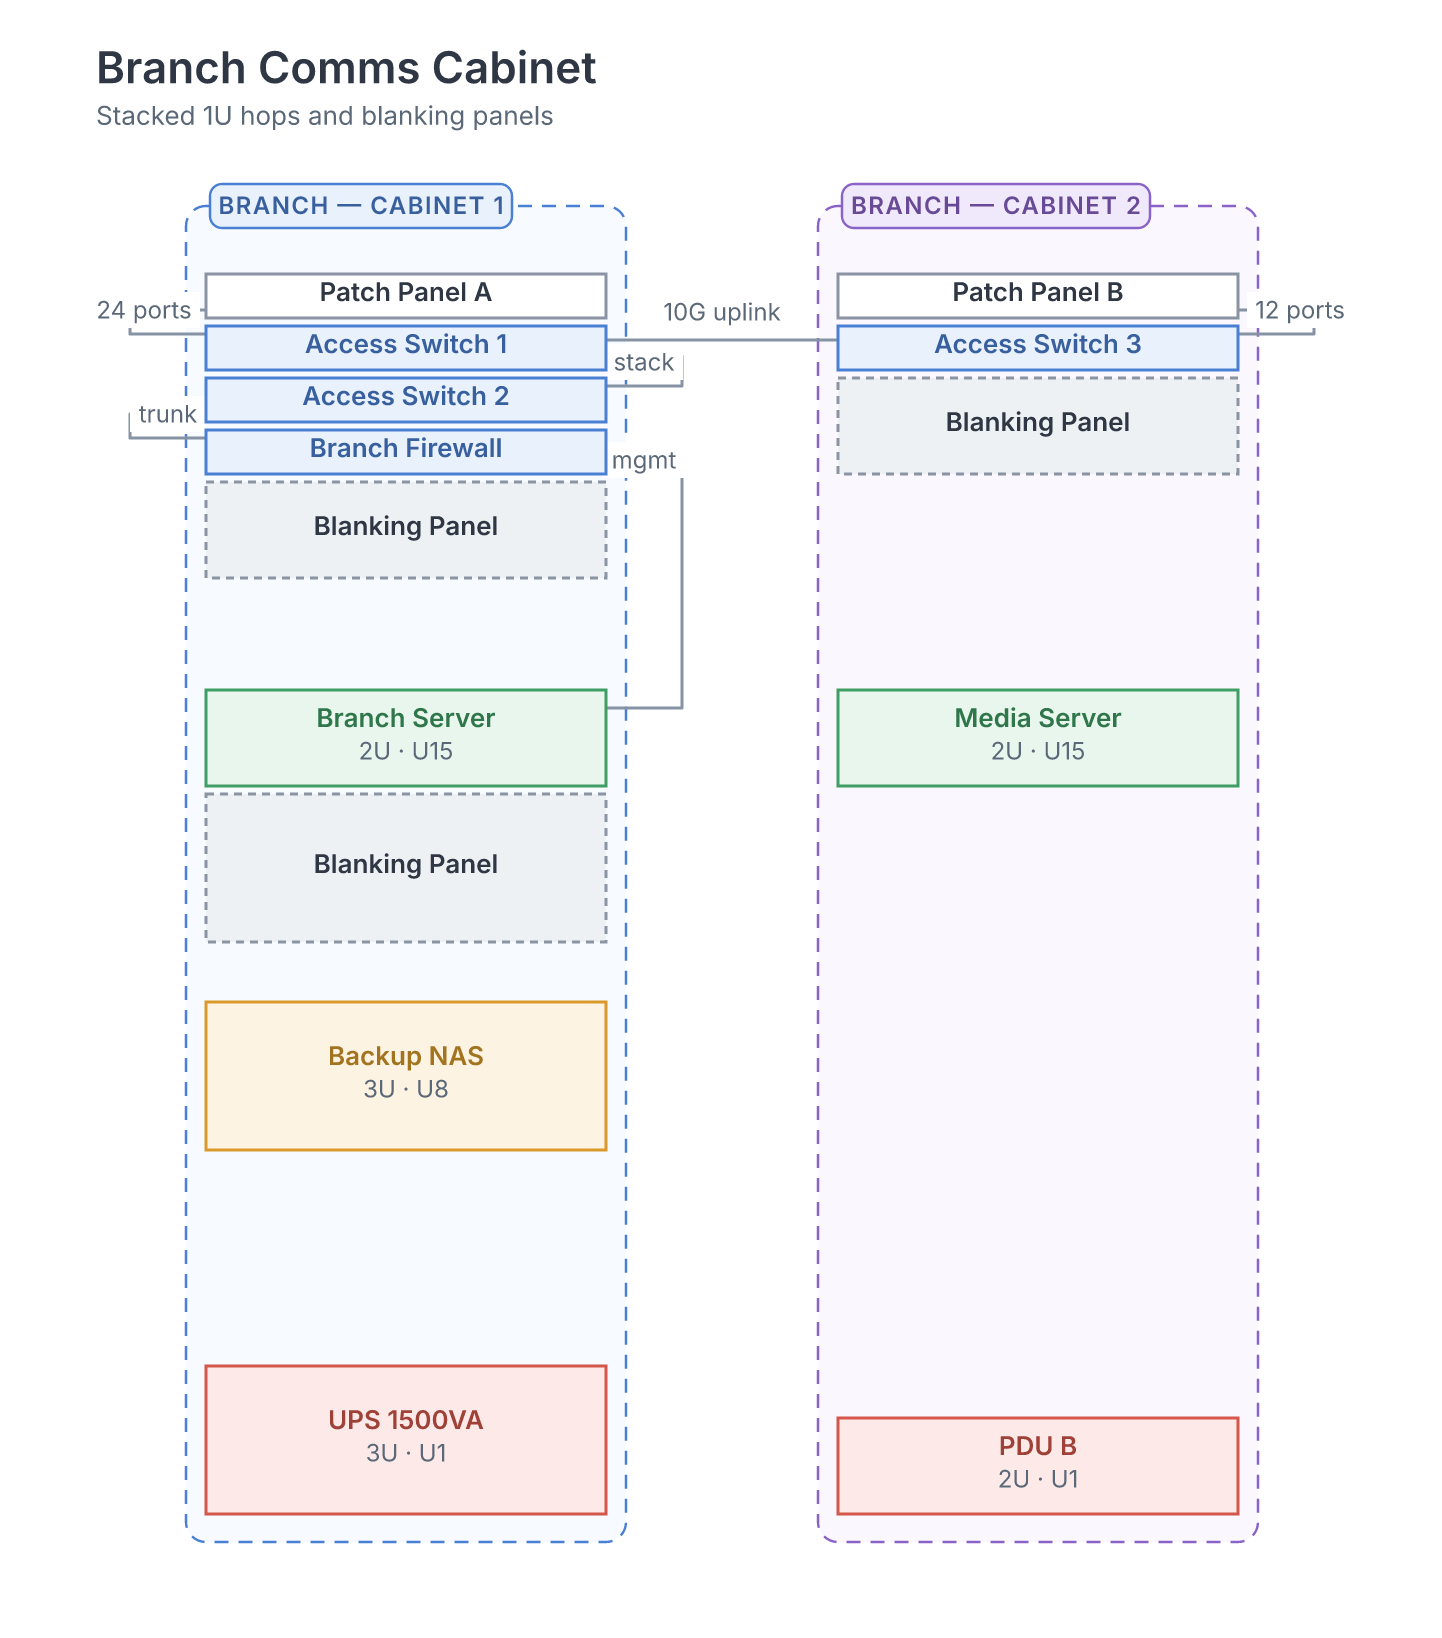
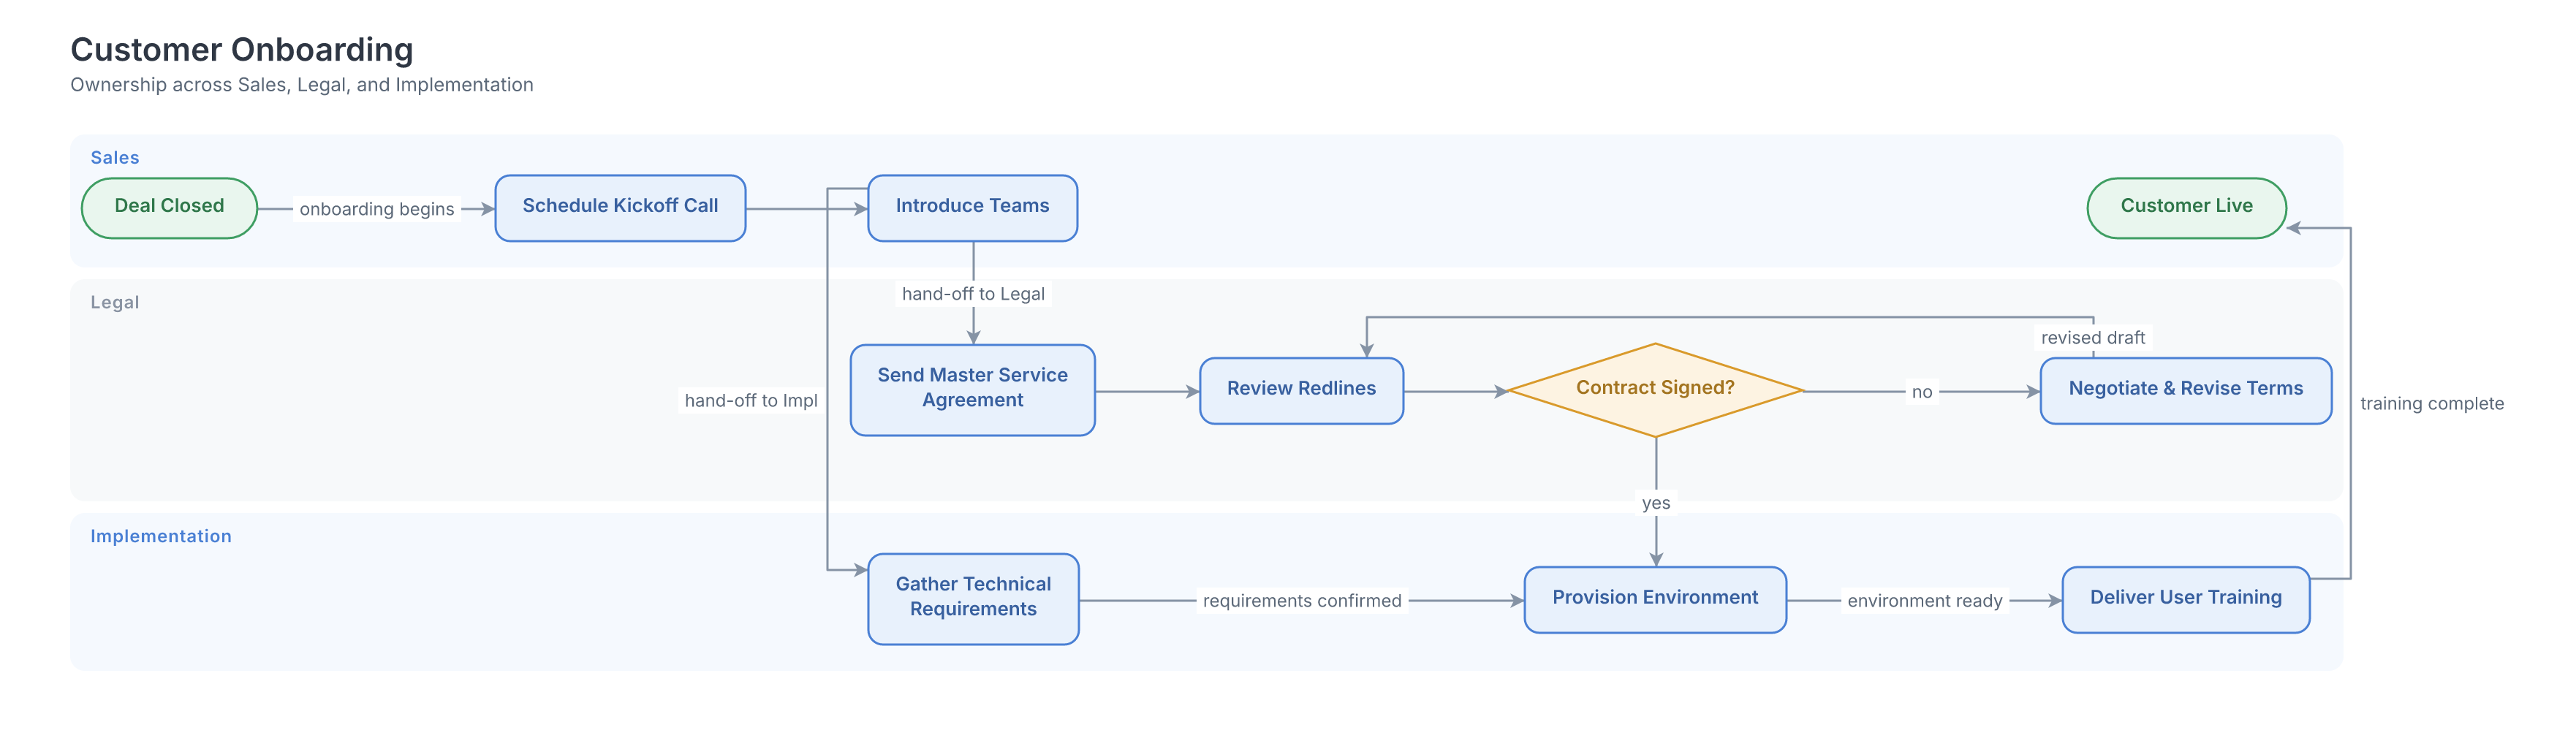
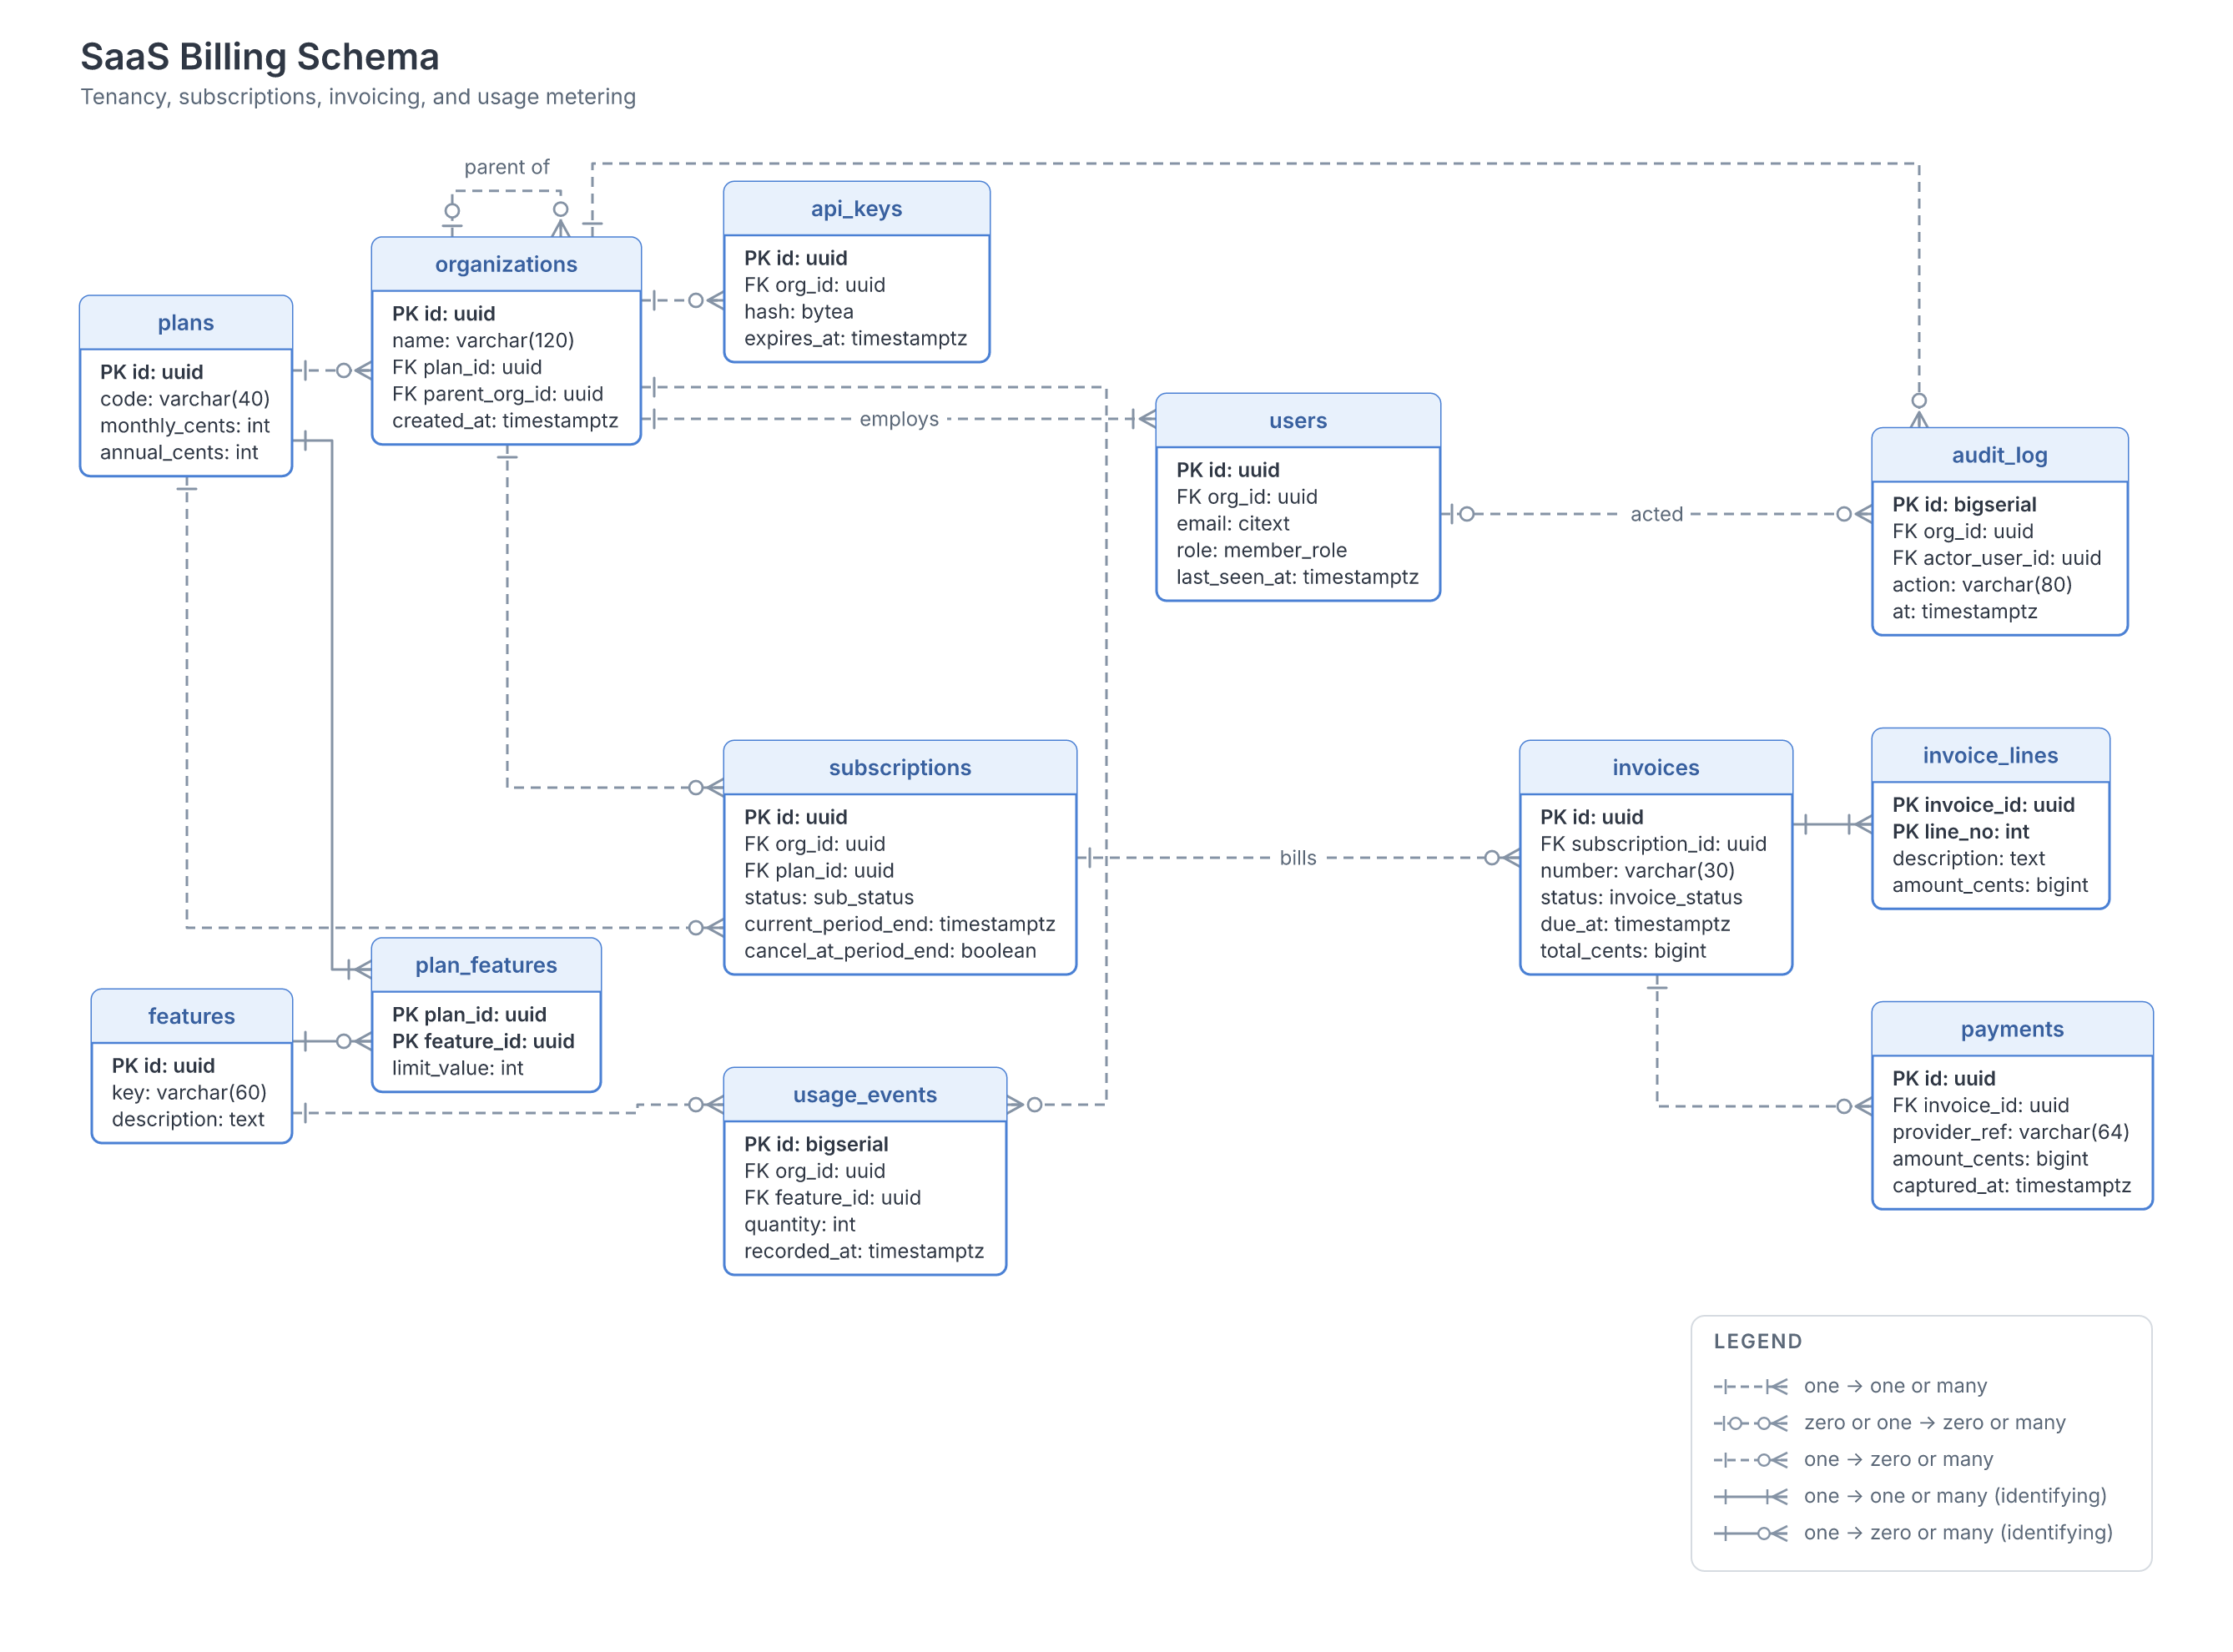
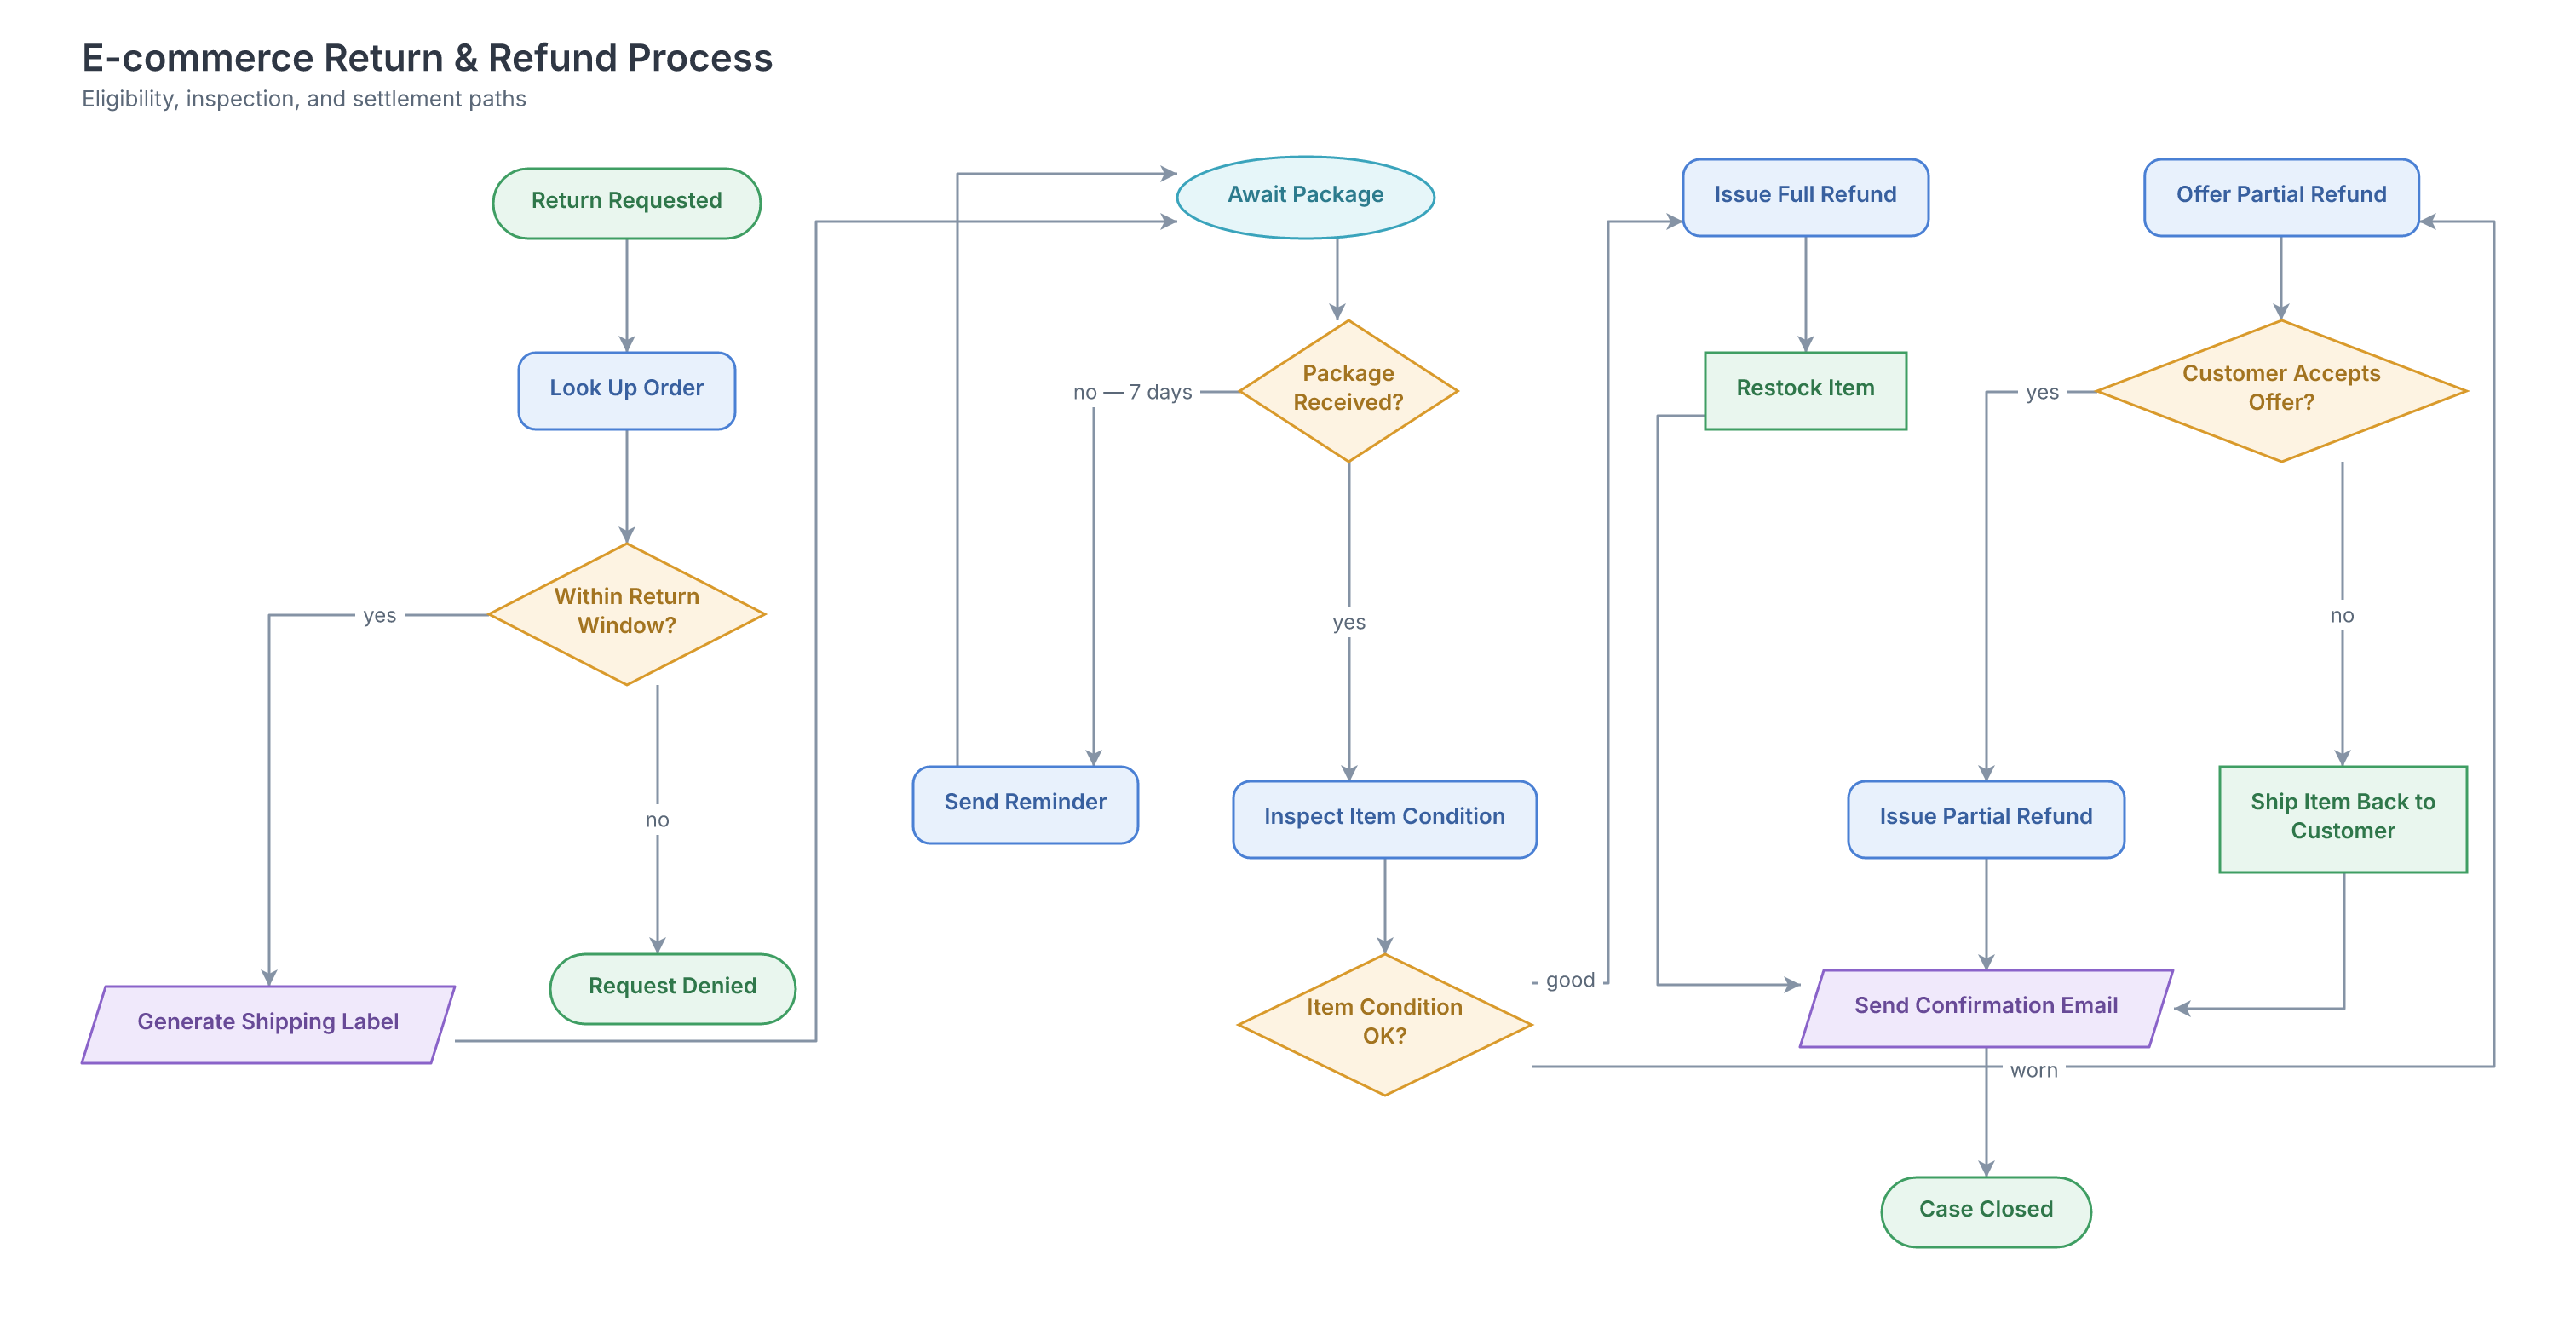
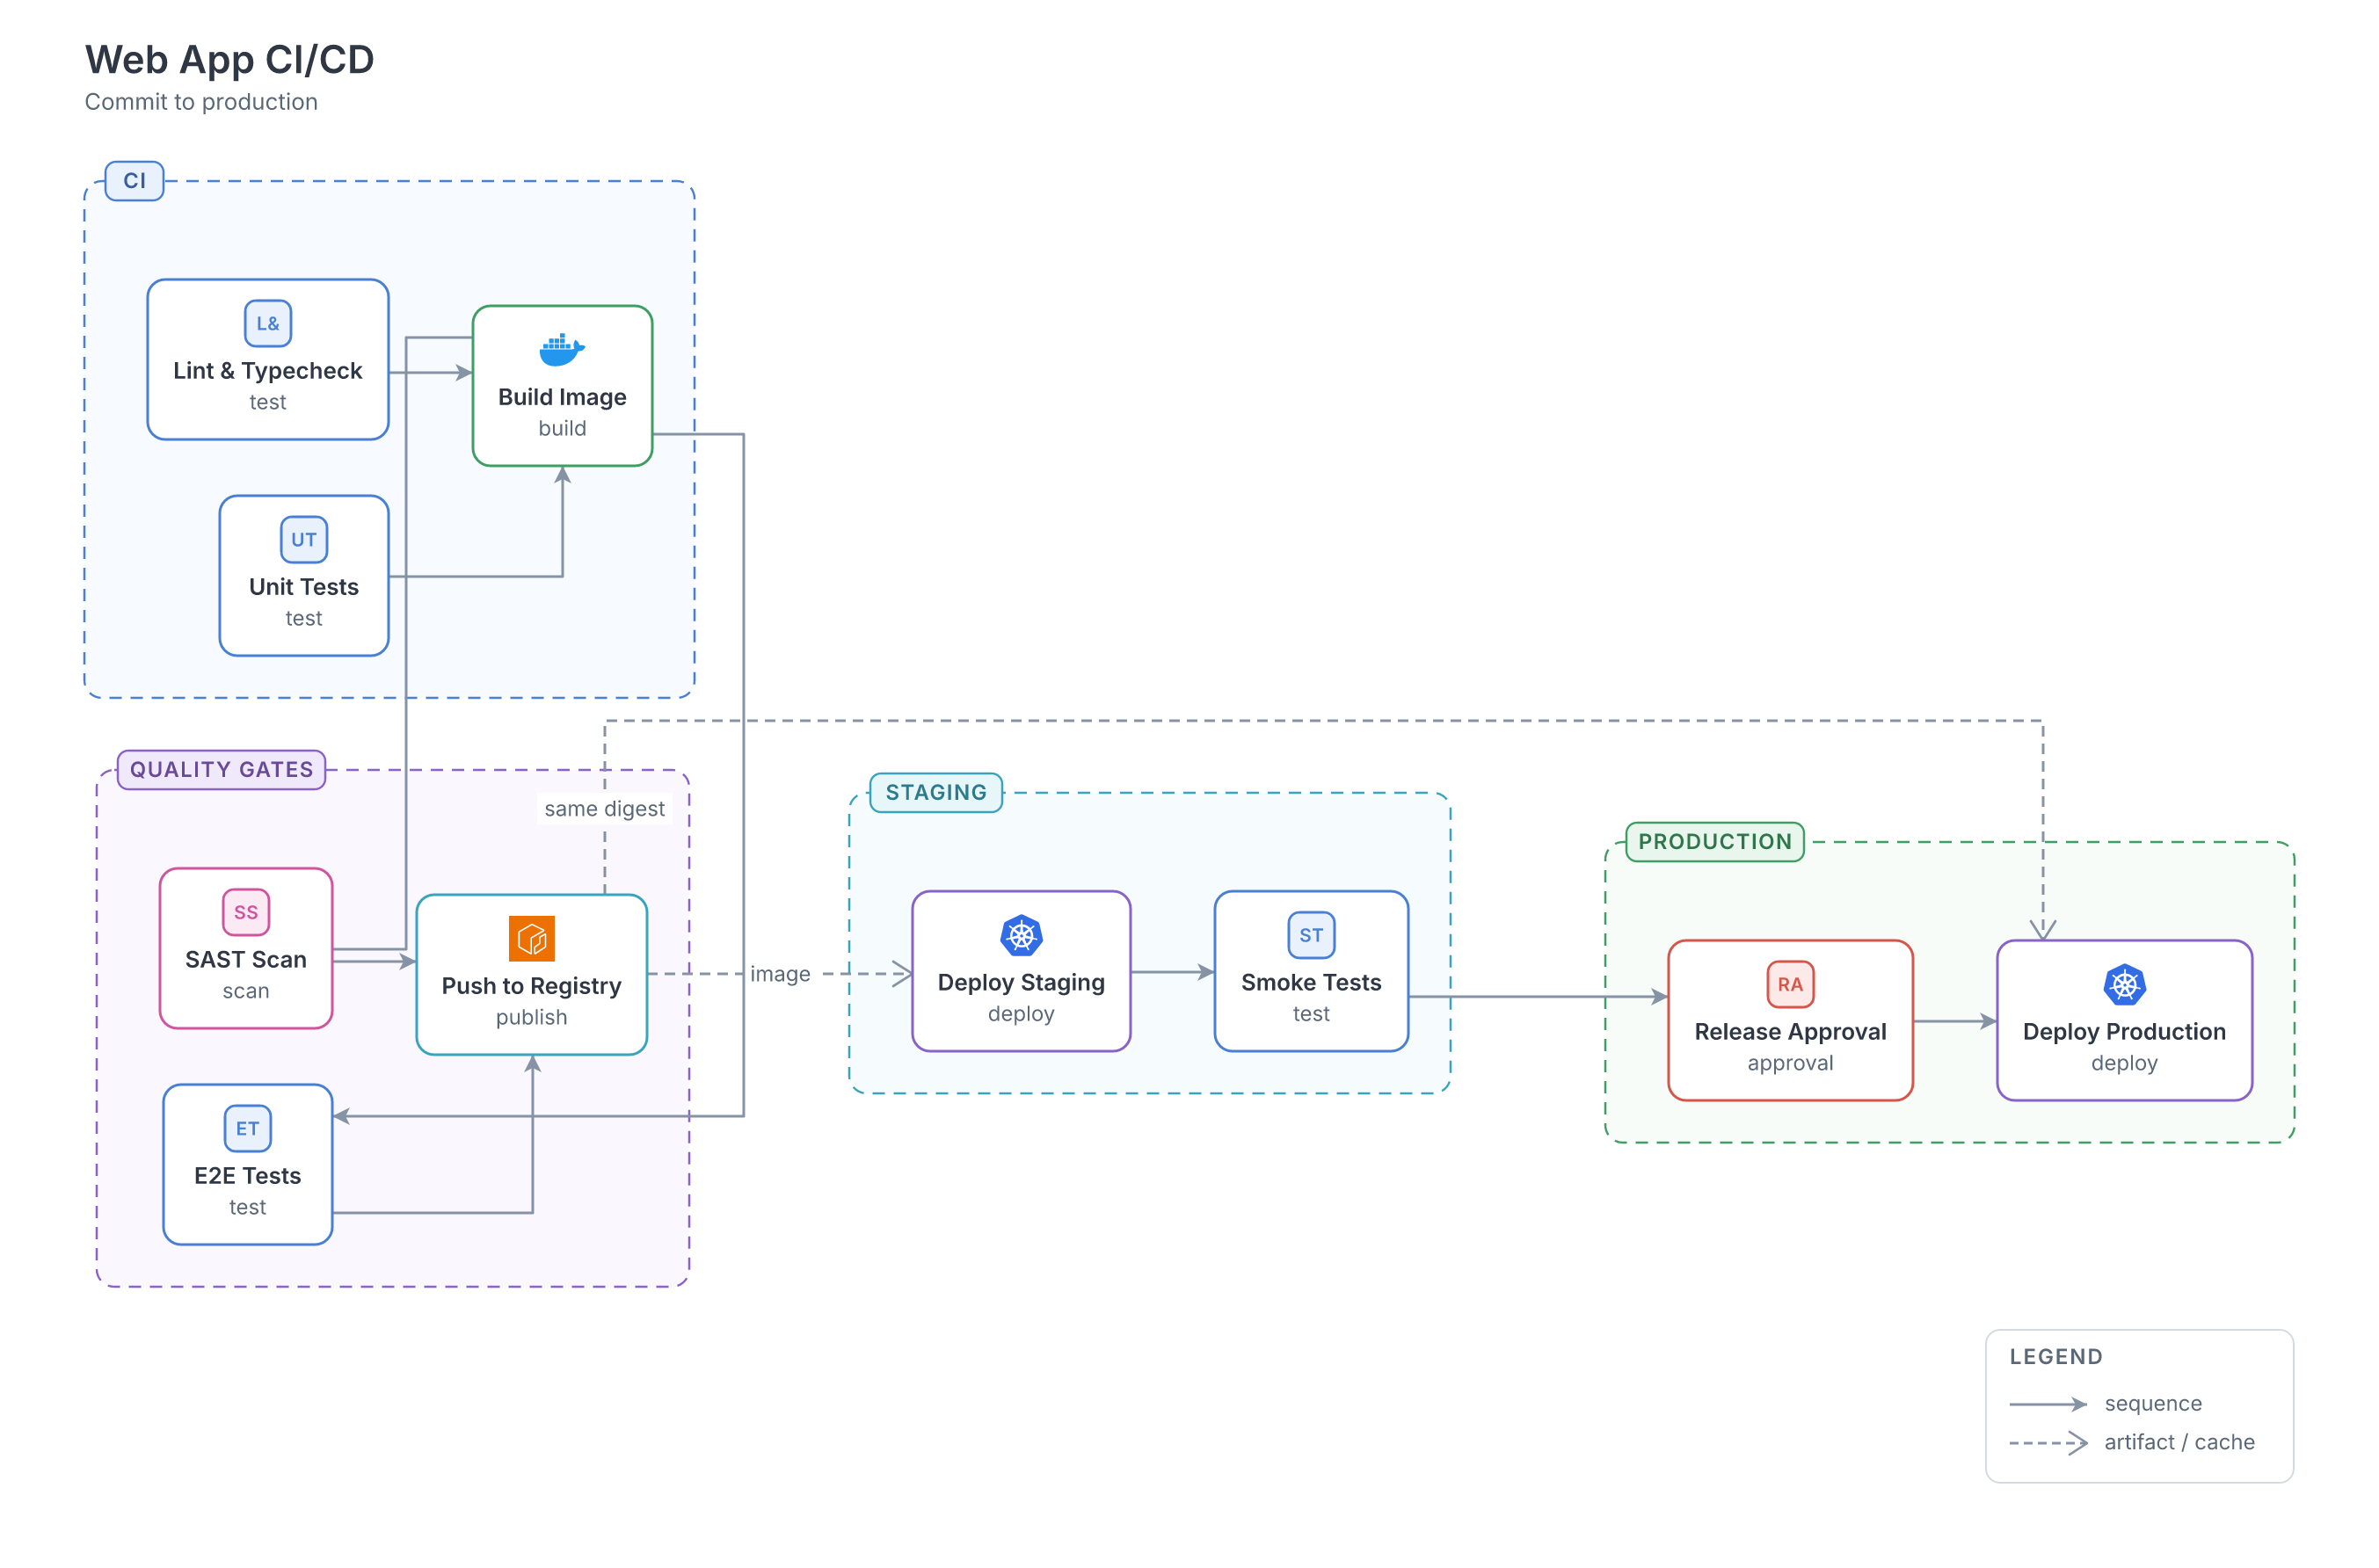
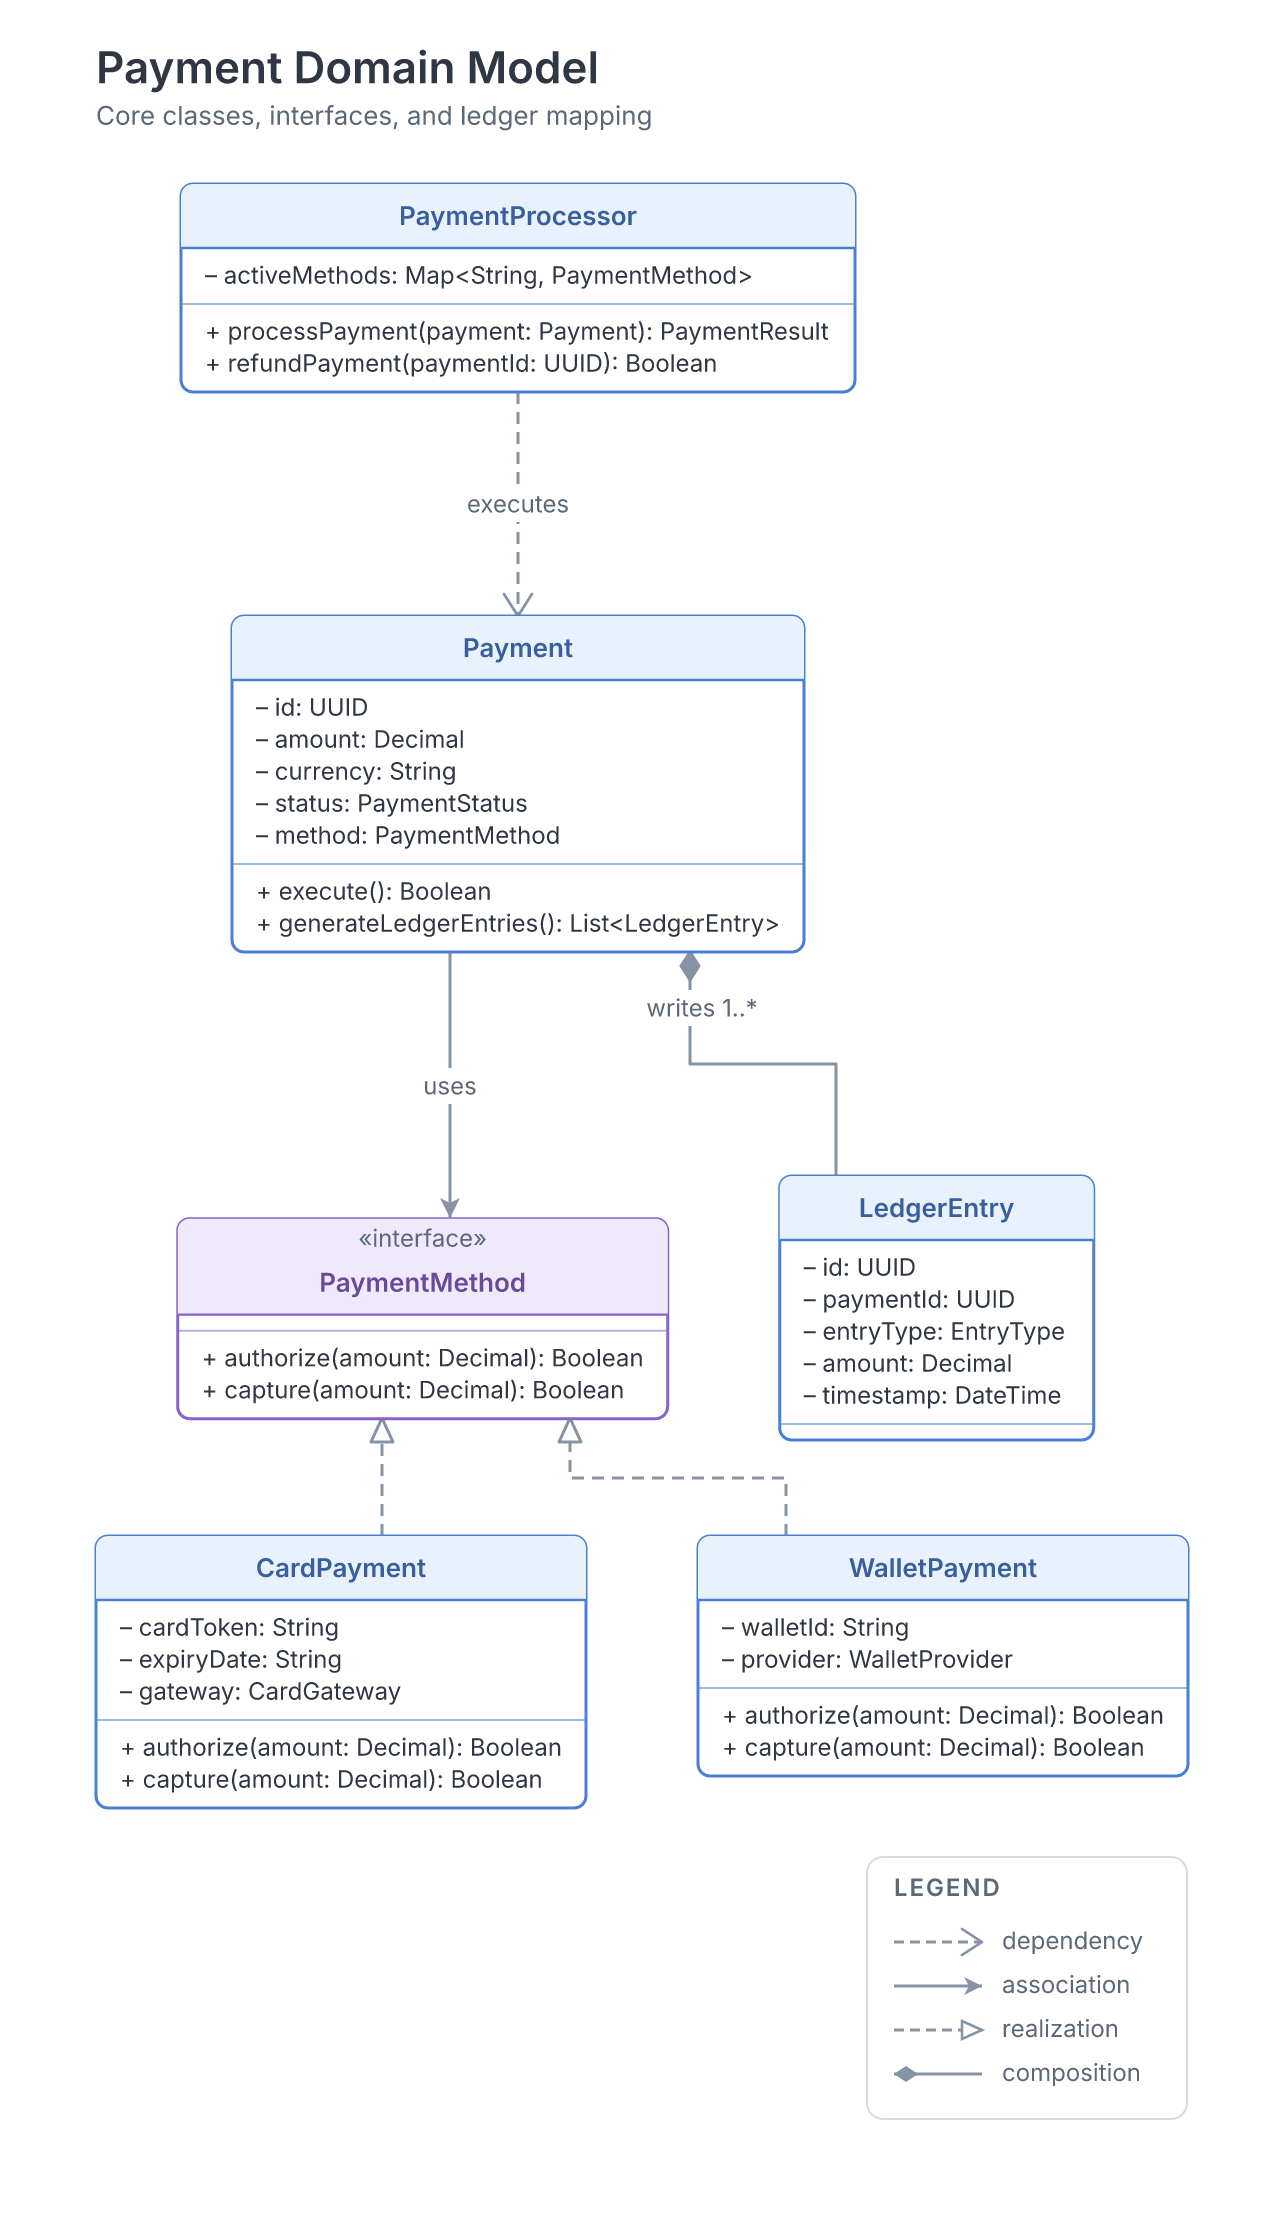
Every image below is a real render, pinned in CI by a golden pixel digest. This is exactly what the engine draws today; a single moved pixel fails the build.
03How it works
A family plugin contributes a schema, a normalizer into a shared graph IR, a placement choice and its notation tables. Nothing else. The pipeline that does the hard work is written once and shared by all eleven families; a lint rule fails the build if a family ever reaches into it.
measure ─▶ place ─▶ route ─▶ labels ─▶ icons ─▶ colour ─▶ fit ─▶ NGD
The first stage is the one that outranks all others: measurement drives everything. Every box is sized from its real content, with the renderer's own font metrics, before placement begins. No default node size exists anywhere in the codebase, and downstream stages honour the measured sizes exactly. Labels are sized objects that reserve space, not decoration sprinkled on at the end.
Output is a Normalized Geometry Document: positioned nodes, orthogonal routes with at most two bends, collision-free labels, colour roles rather than hex values, icon catalogue ids rather than artwork. Any conforming renderer can draw it without re-measuring or nudging a thing.
04What a program looks like
// a complete program. note what is absent: geometry.
{
  "version": 1,
  "kind": "architecture",
  "title": "Checkout",
  "nodes": [
    { "id": "web", "label": "Storefront", "role": "service",   "iconHint": "browser"  },
    { "id": "db",  "label": "orders_db",  "role": "datastore", "iconHint": "postgres" }
  ],
  "relations": [
    { "id": "r1", "from": "web", "to": "db", "label": "SQL", "kind": "data" }
  ]
}
That is the whole input. The engine returns fully resolved geometry that any conforming renderer can draw without re-measuring a thing.